The 10 best web designing tools: Infographics
We are happy to introduce our fourth article about 100 the best web designing tool and more precisely about Infographics. Infographics is a visual representation of complex and complicated information in a simple and clear manner. For web designers, it is very important to have proper graphic software to create the desired content. In this articles will be covered ten different Infographics tools that would facilitate the designing process.
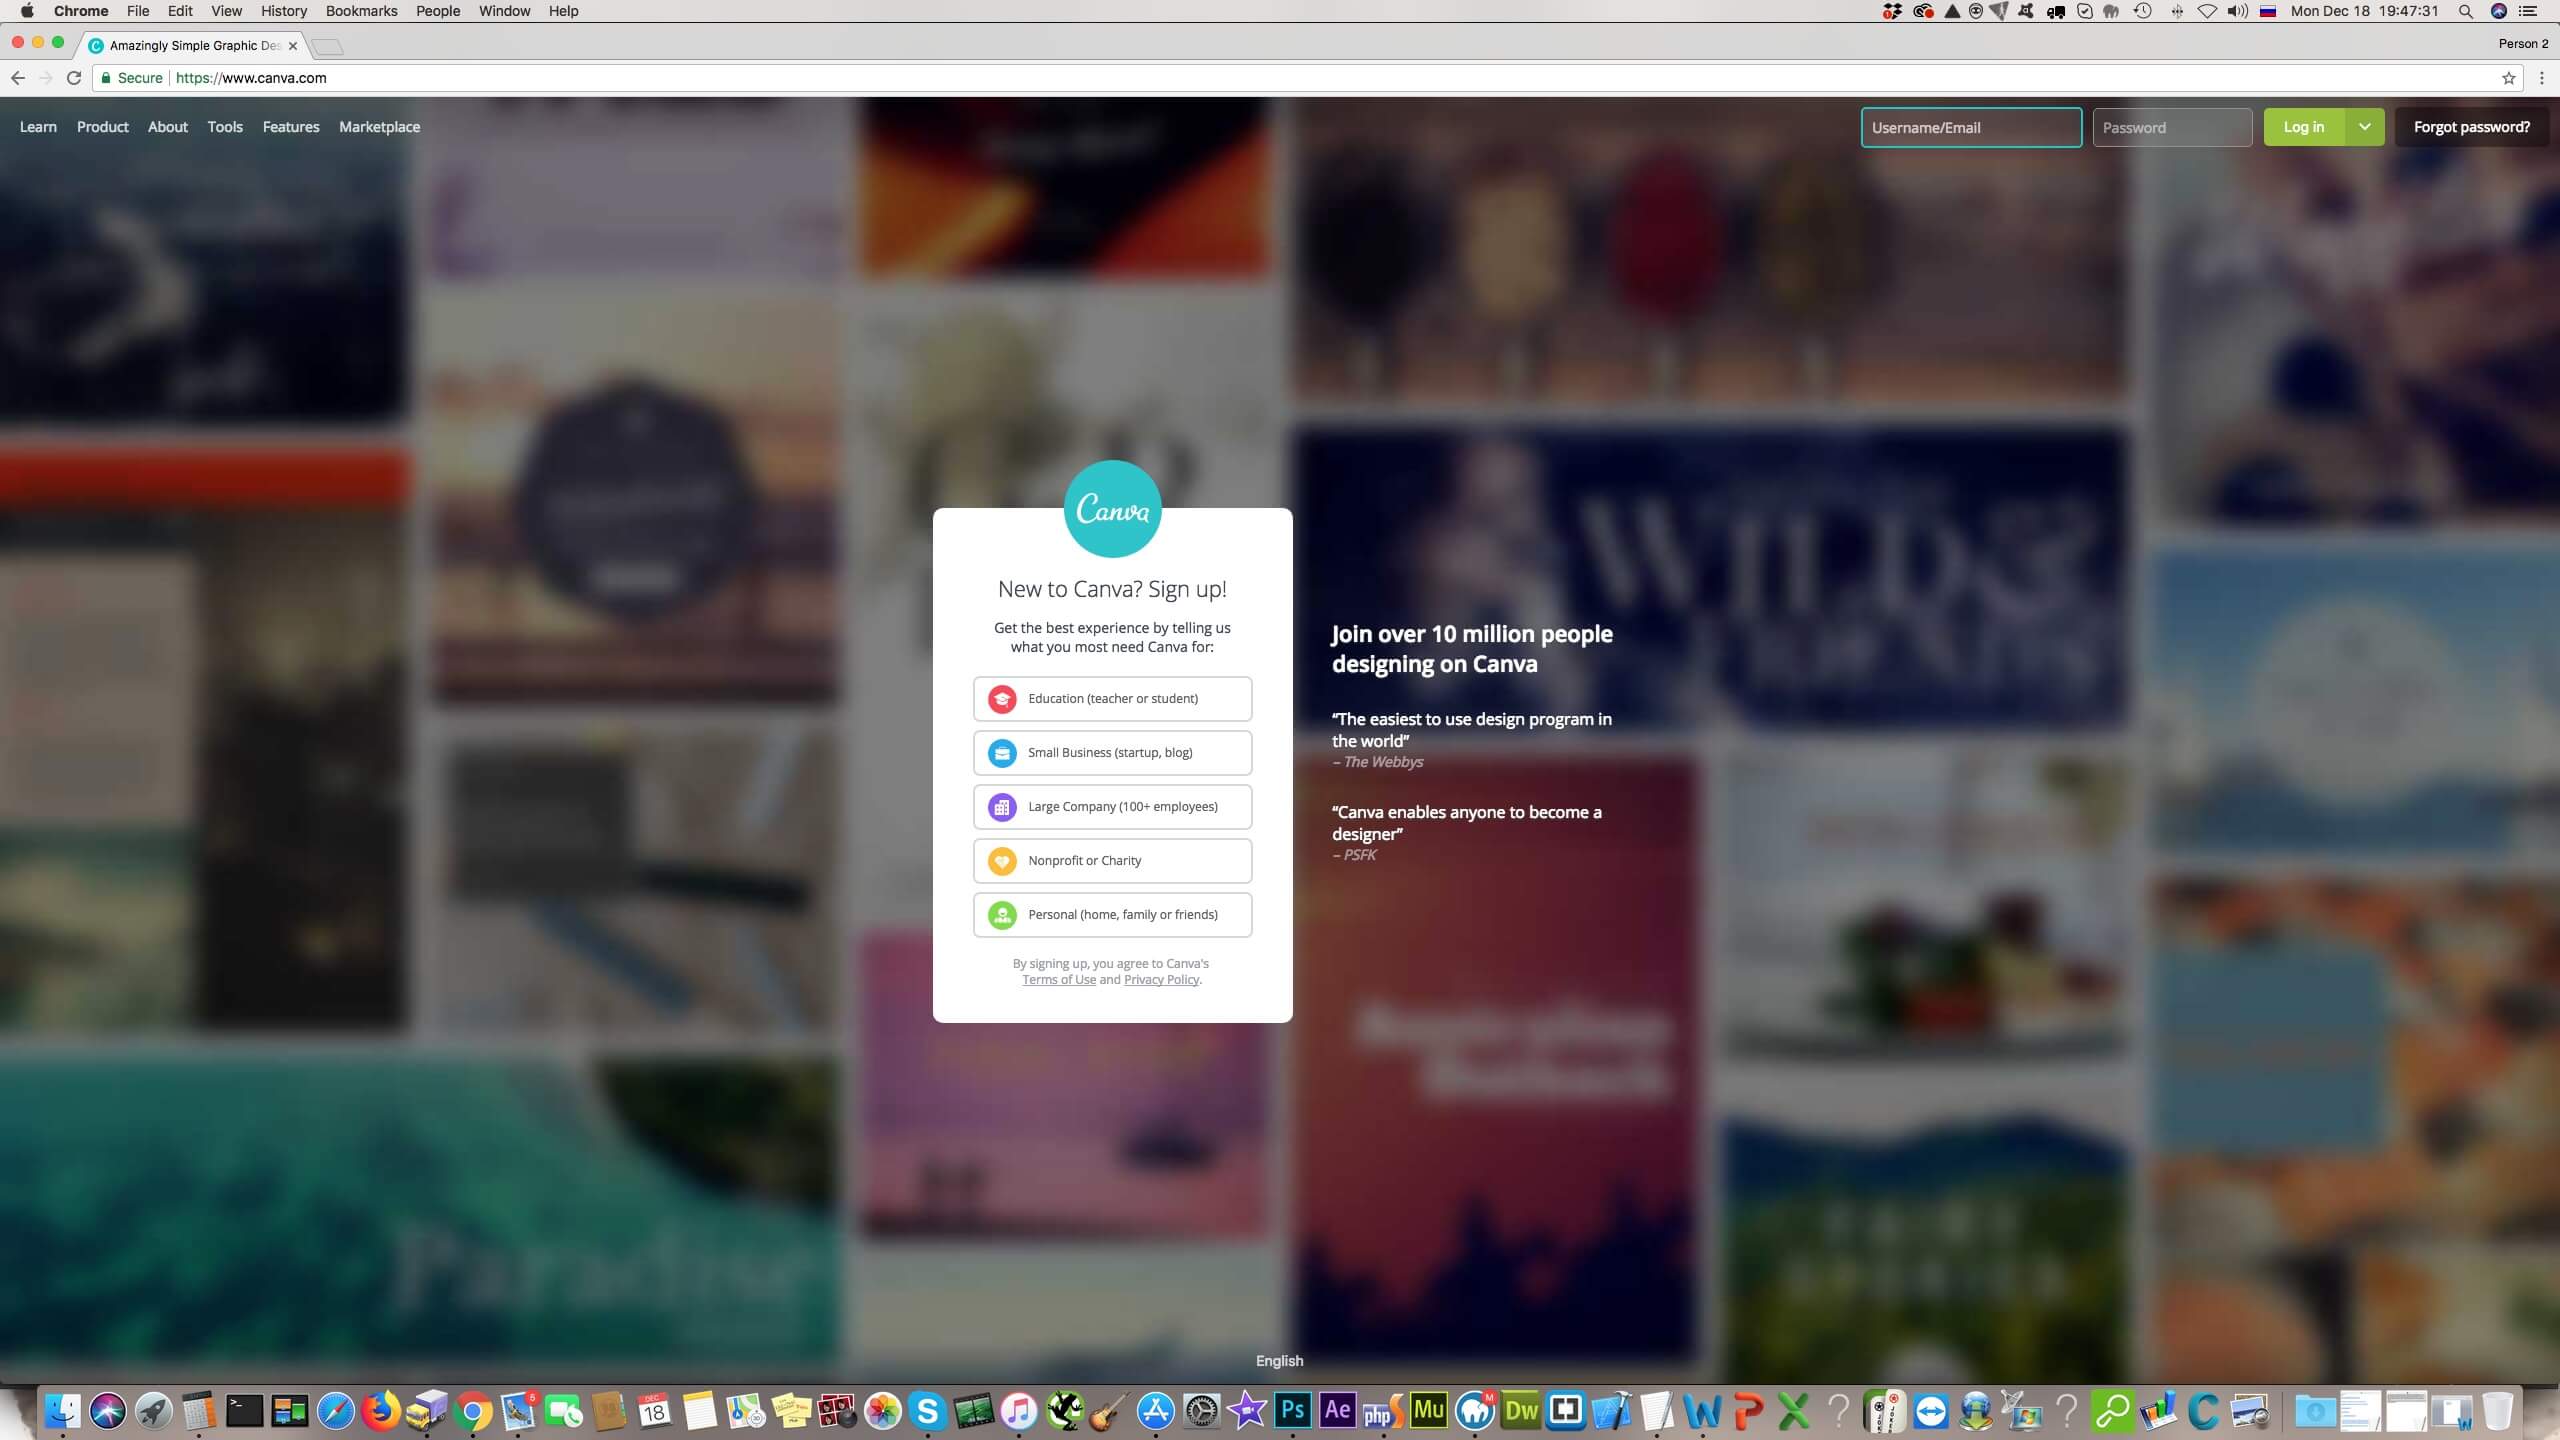
1. Canva – It is a free tool for graphic-design founded in 2012, Australia. It quickly became popular and currently is used by thousands of people, professional and amateur designers. Canva’s infographic tool compromises various free design elements that allow customers to experiment with data representation like a professional. The end product, designed via Canva’s tool, can be used for presentation, website, blog, printed flyers, brochures and etc. Customers can also save and share the infographic design multiple times in Canva, which enable them to reuse it online. The most of the elements in the Canva’s library are free of charge but some of them are also premium elements that do not cost more than 1$. For more thorough information please visit their official webpage: https://www.canva.com/
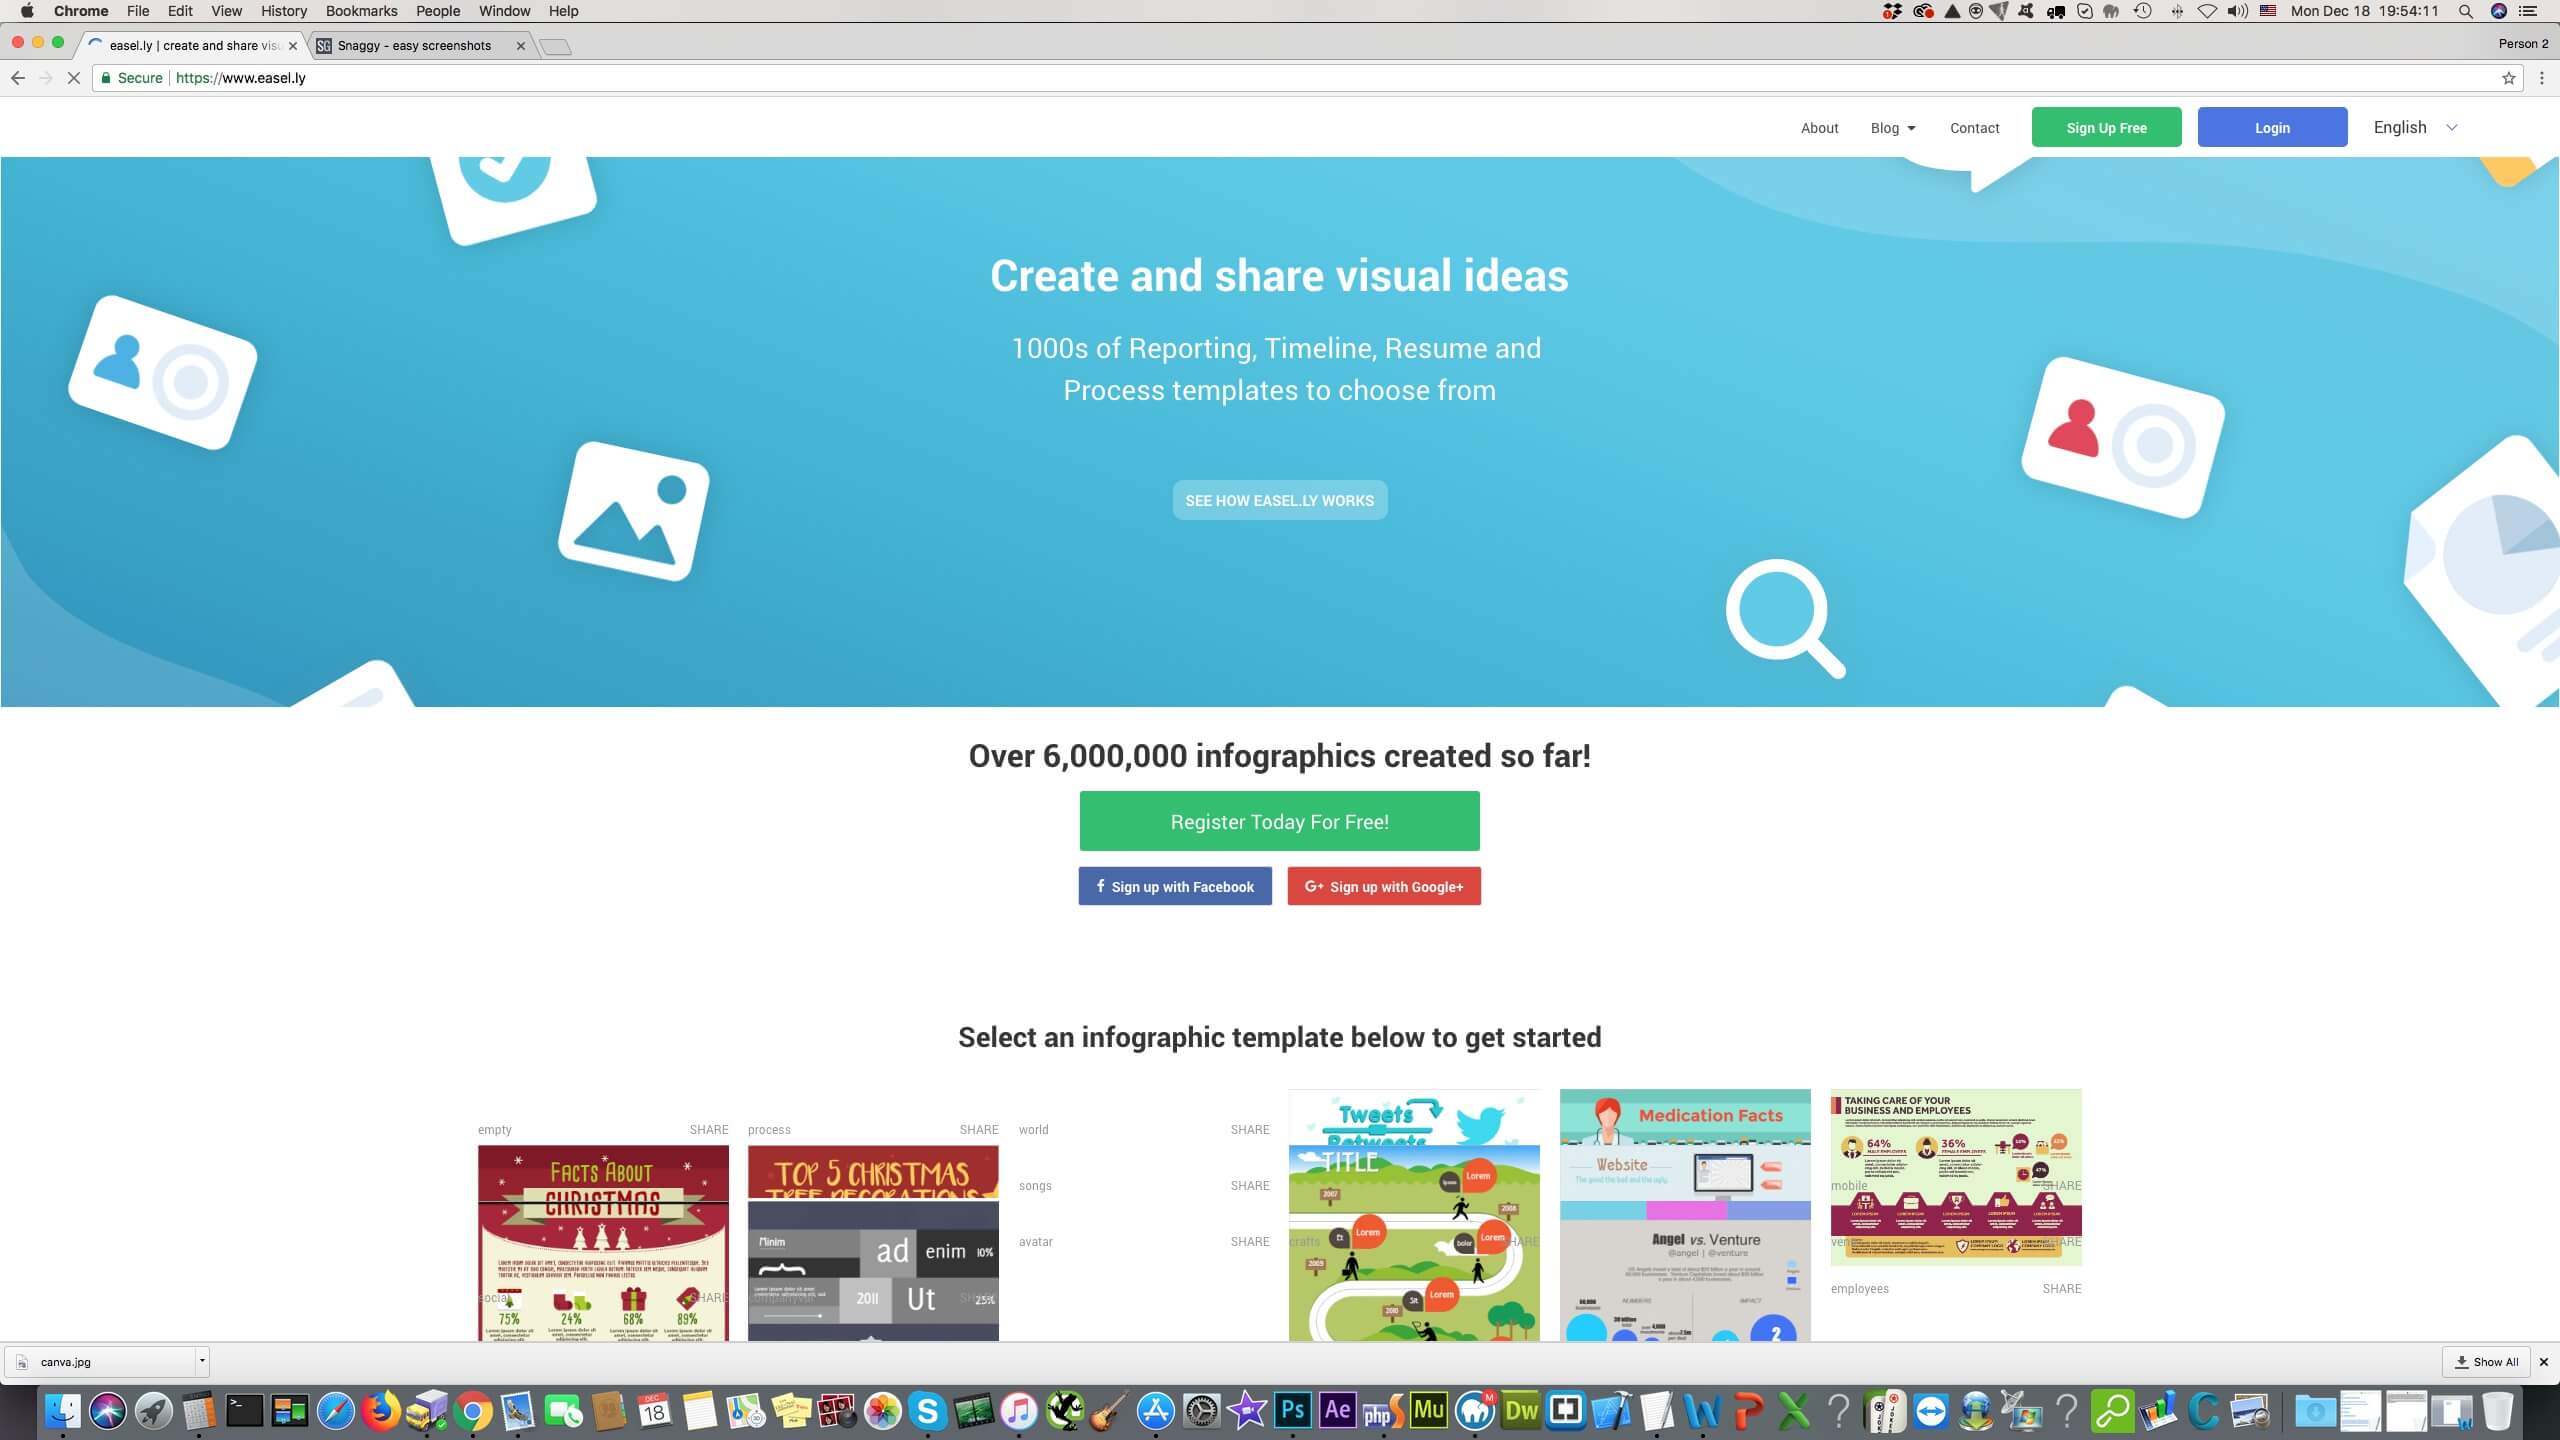
2. Easel.ly – It is a website that provides thousands of free infographic themes and design objects that can be employed by customers to create their own visual ideas online. Creating the infographics through Easl.ly is very easy because it has drag and drop function, so customers just have to choose the design. Customers can also upload their own background image and begin from scratch. Easel.ly was officially founded in 2012 and since then it is getting more and more popular, more than 300 000 registered users are using the benefits of website each month. It has made possible for anyone to design their own infographics within couple of minutes. To try out the tool, please follow thins that will direct you to the official website: https://www.easel.ly/
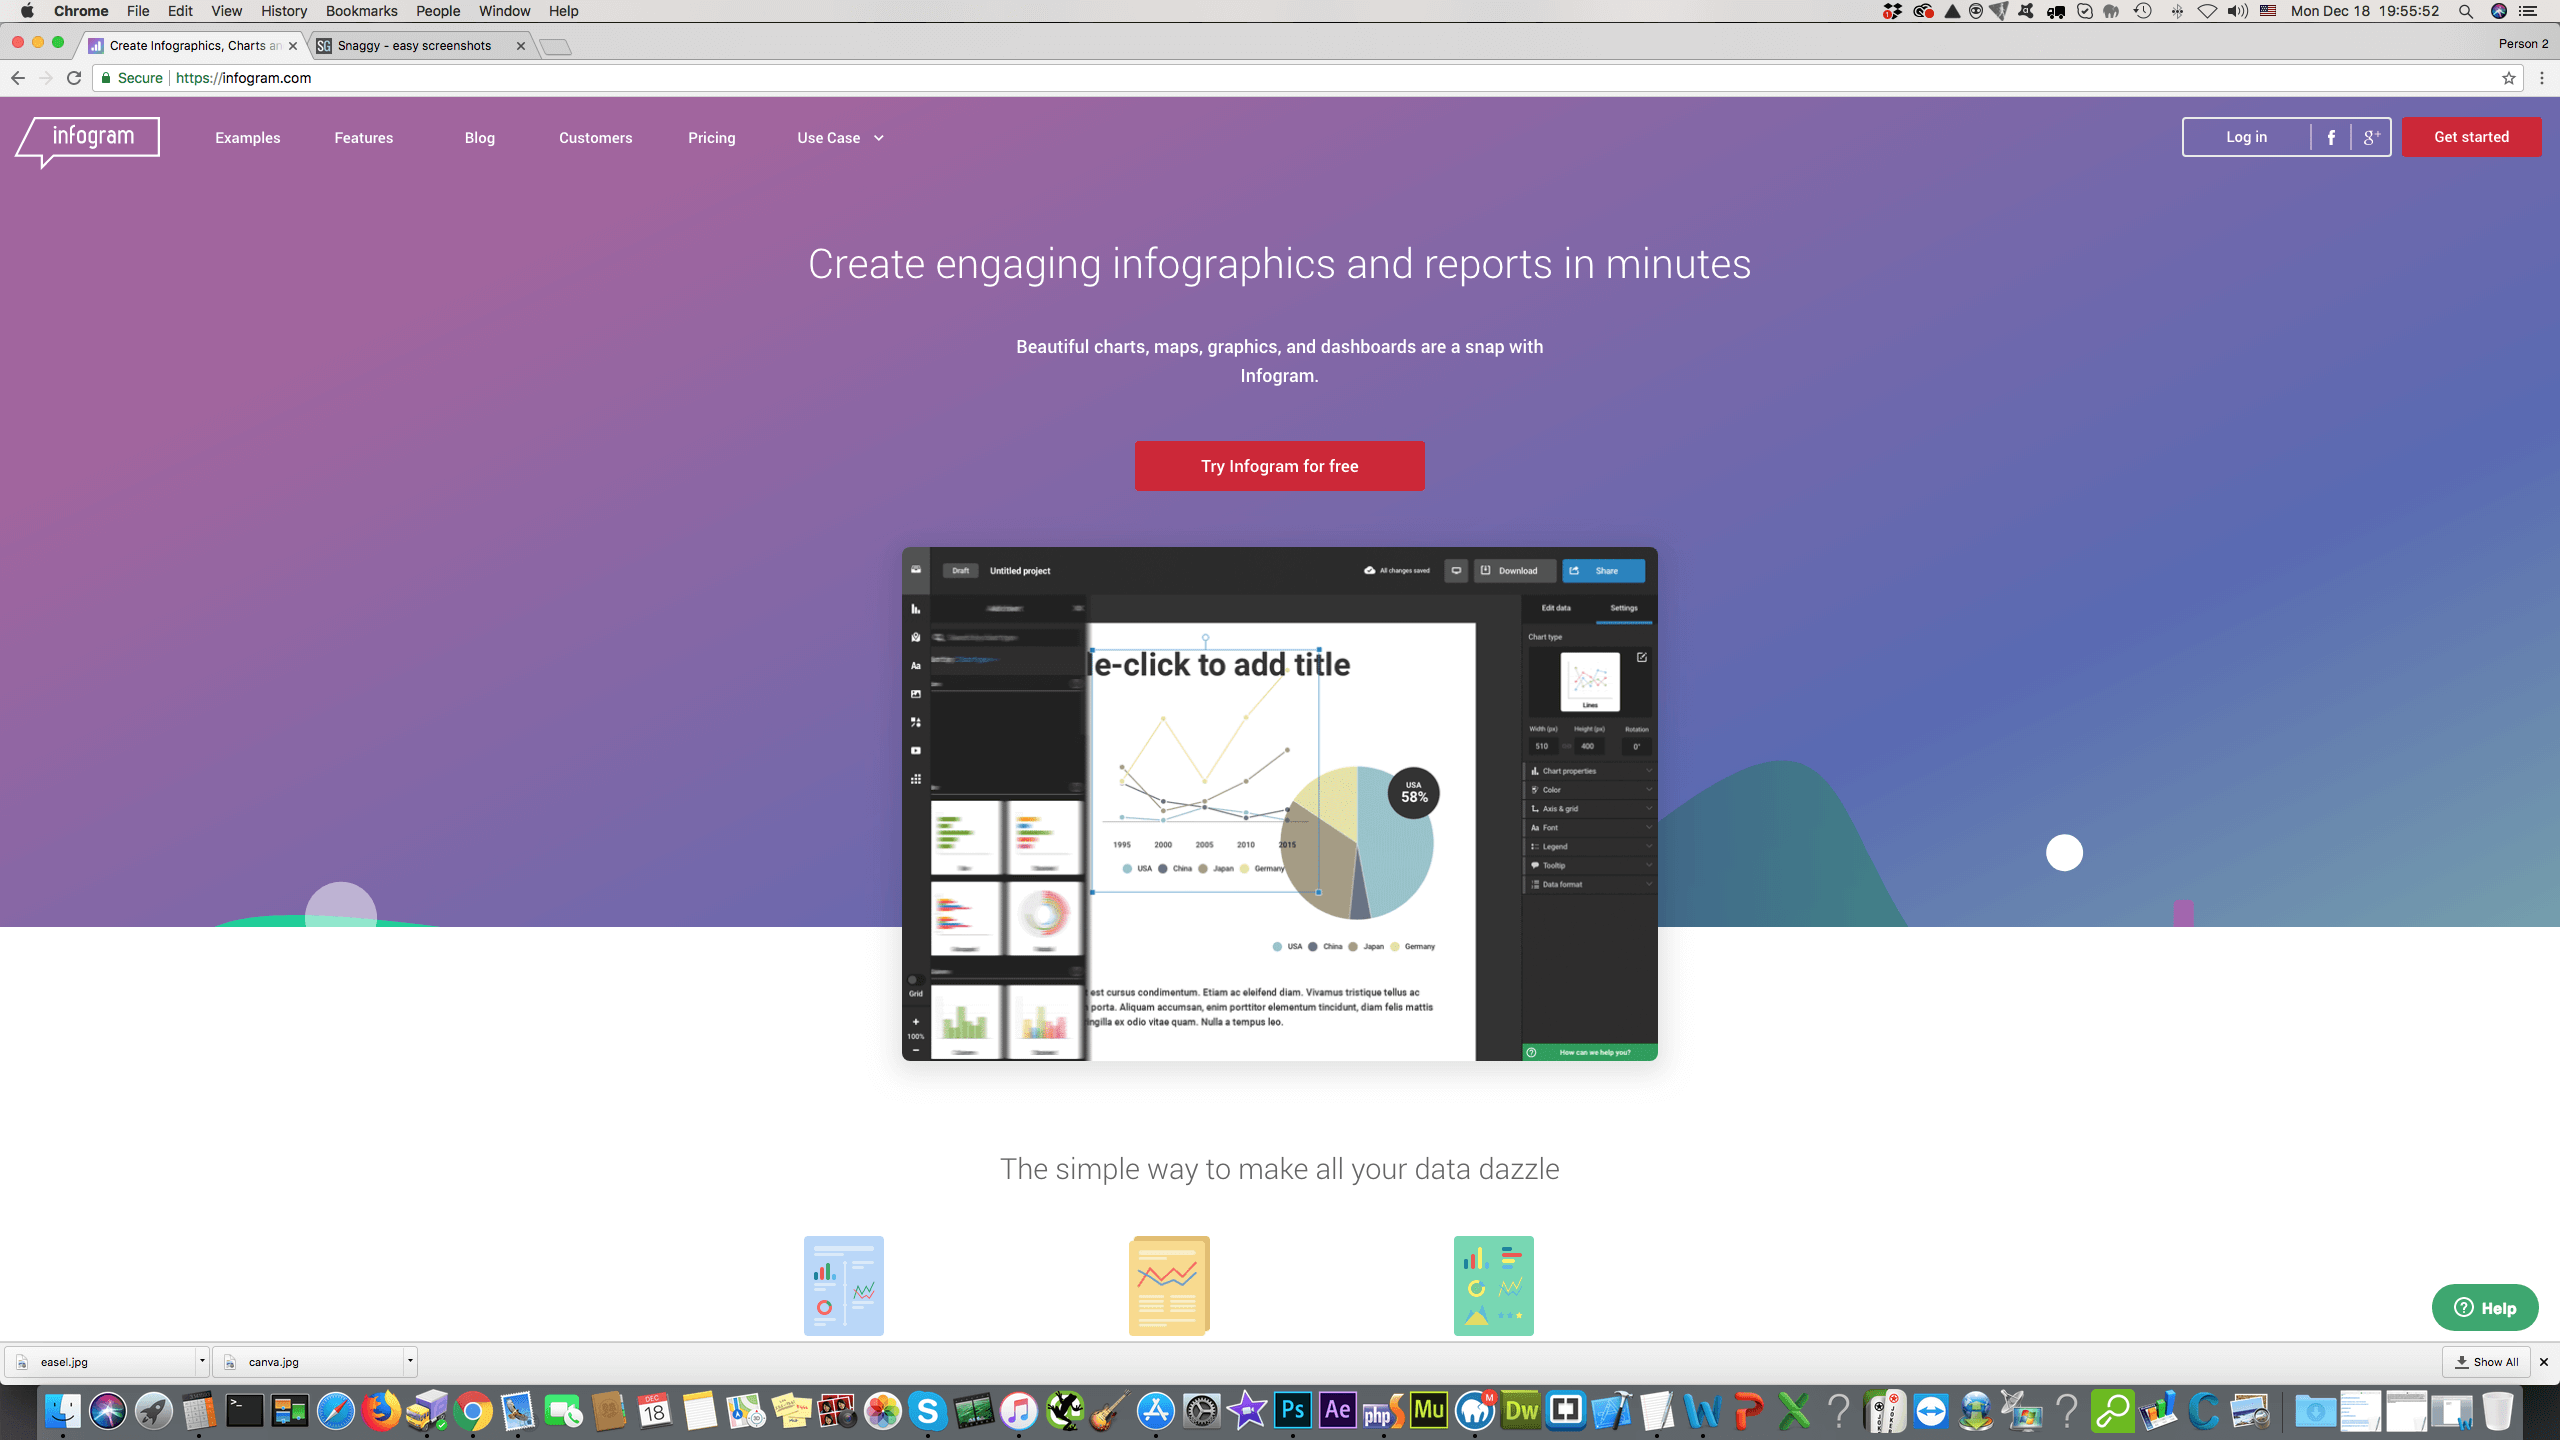
3. Infogram – It is a tool that helps people and businesses to create infographics to present and share data in a simple, clear and engaging way. The Infogram was also launched in 2012, as the two above mentioned tools, and rapidly became popular on the market due to its functionality and simplicity. The tool can be used by various people like professional or amateur designers, marketers, journalists, students, companies and etc. Basically anyone who wans to present their information in a nice and neat way. Infogram is already employed by thousands of users who have created more than 4.5 million infographics that can be viewed by everyone. Infogram can be used for free but it also offers different price packages for more features and benefits. To check out the details please follow this link: https://infogram.com/
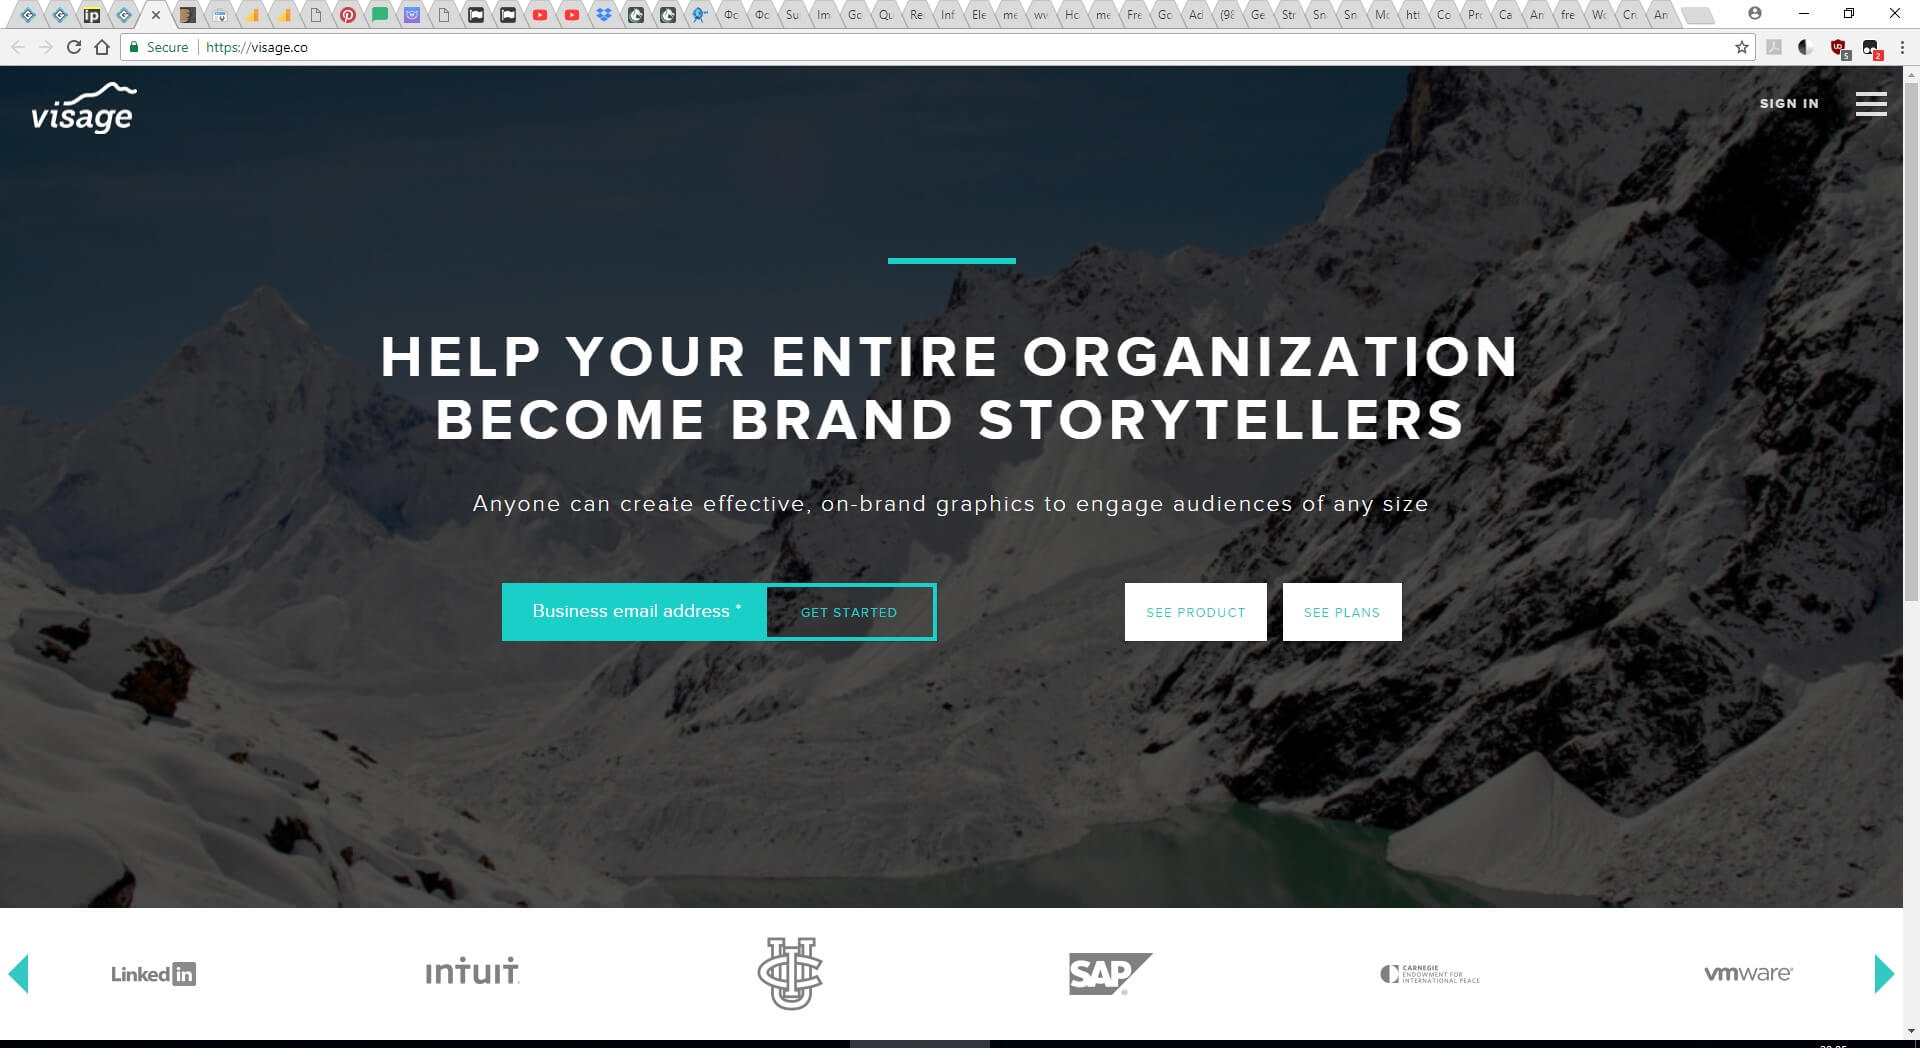
4. Visage – It is a tool that provides a simple interface that can be applied by customers to create any kind of content they want. Nowadays, high quality infographics is a vital part of effective communication. The design agencies are way too expensive, therefore Visage and tools like Visage solve this important problem of web designers and not only. However, to use Visage and its features there is a price that has to be paid. It offers different price packages but the basic (minimum) price is 50$. If you are interested in the provided tool, please visit their official webpage for more thorough information. The website can be found here: https://visage.co/
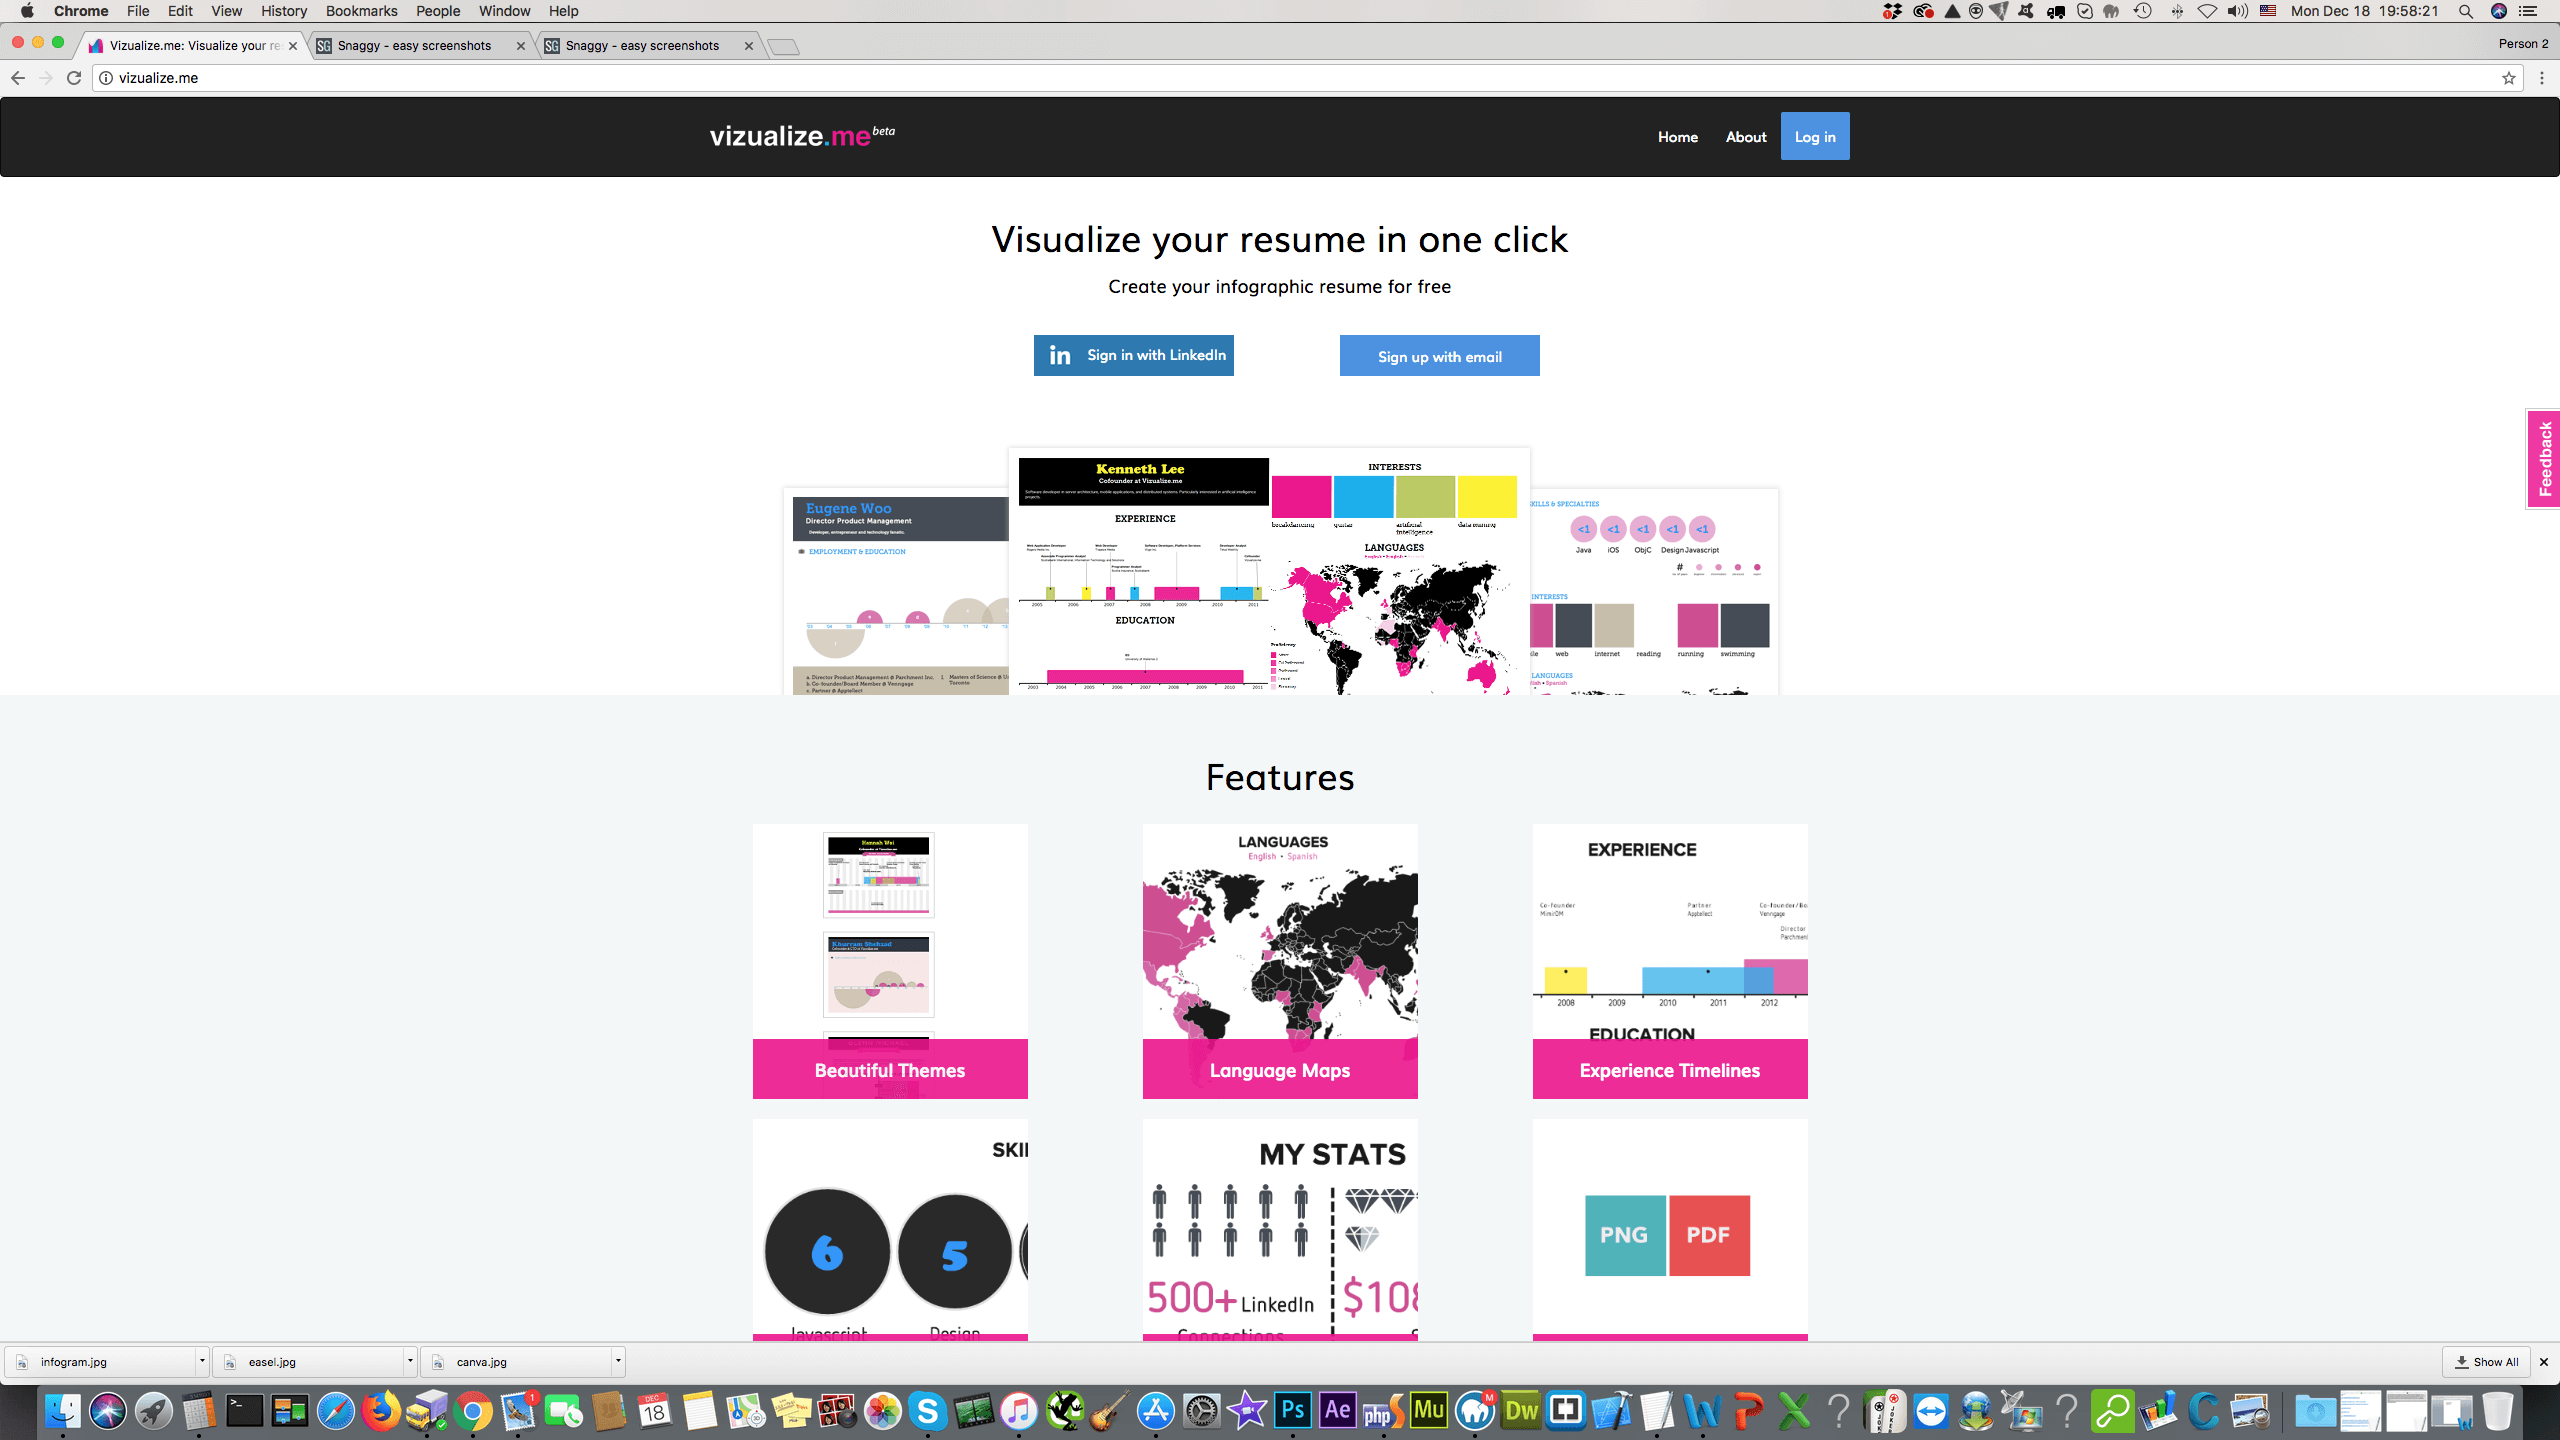
5. Vizualize.me – It is a tool that is employed to transfer boring resumes (CVs) into interesting and original ones via infographics. Vizualize.me wants to eliminate the traditional text resume and replace it with online resume format which is beautiful, relevant and distinctive. This tool enables people to express their educational background and professional accomplishments in a simple but personal way. Customers can subscribe and register for free and use all the benefit of Vizualize.me. For more information, please visit the official website which can be found here: http://vizualize.me/
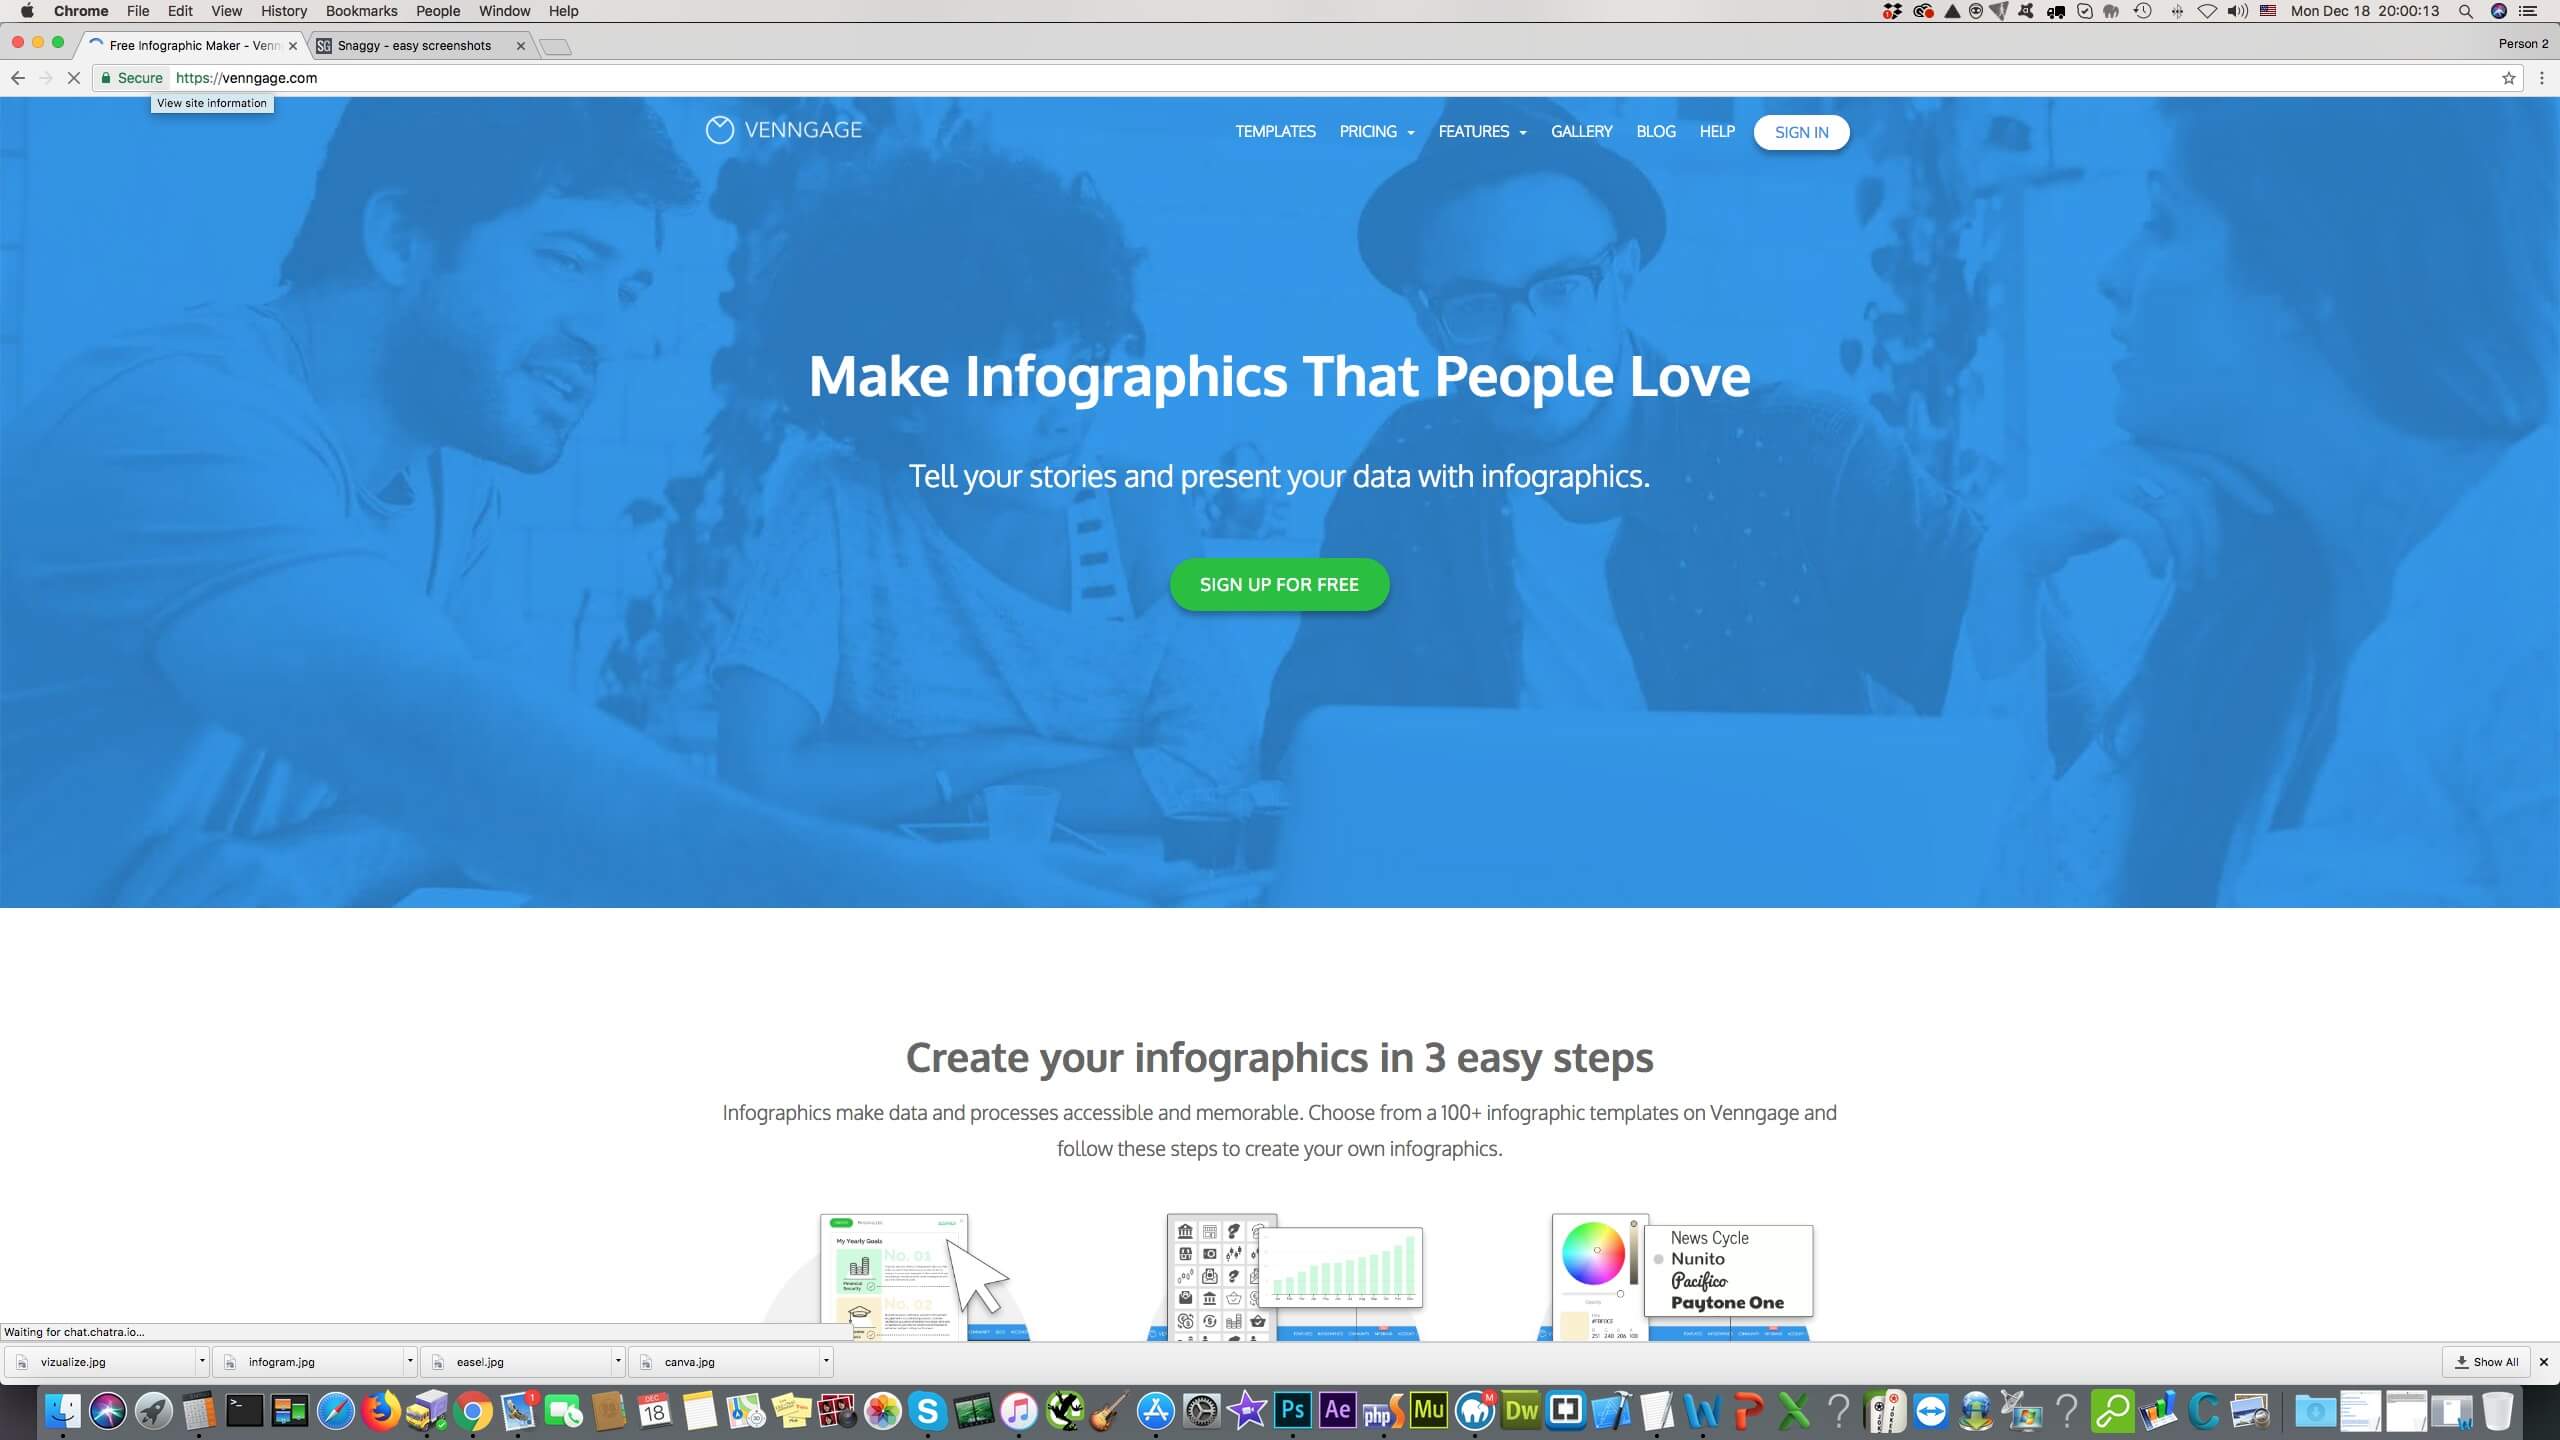
6. Venngage – The tool enables people to tell their stories and present their data with infographics. With Venngage, it is extremely simple to create infographics, there are just three steps: 1. Choose the template 2. Visualize and fill it out with desired data and information, enhance infographic by adding icons and images from the library offered by Venngage 3. Customize your infographic design by altering the fonts and colors and use your own style to make the infographic look original. For students the tool can be used for free but for businesses and individuals there is a small price that has to be paid. For more detailed information, please visit the official website: https://venngage.com/
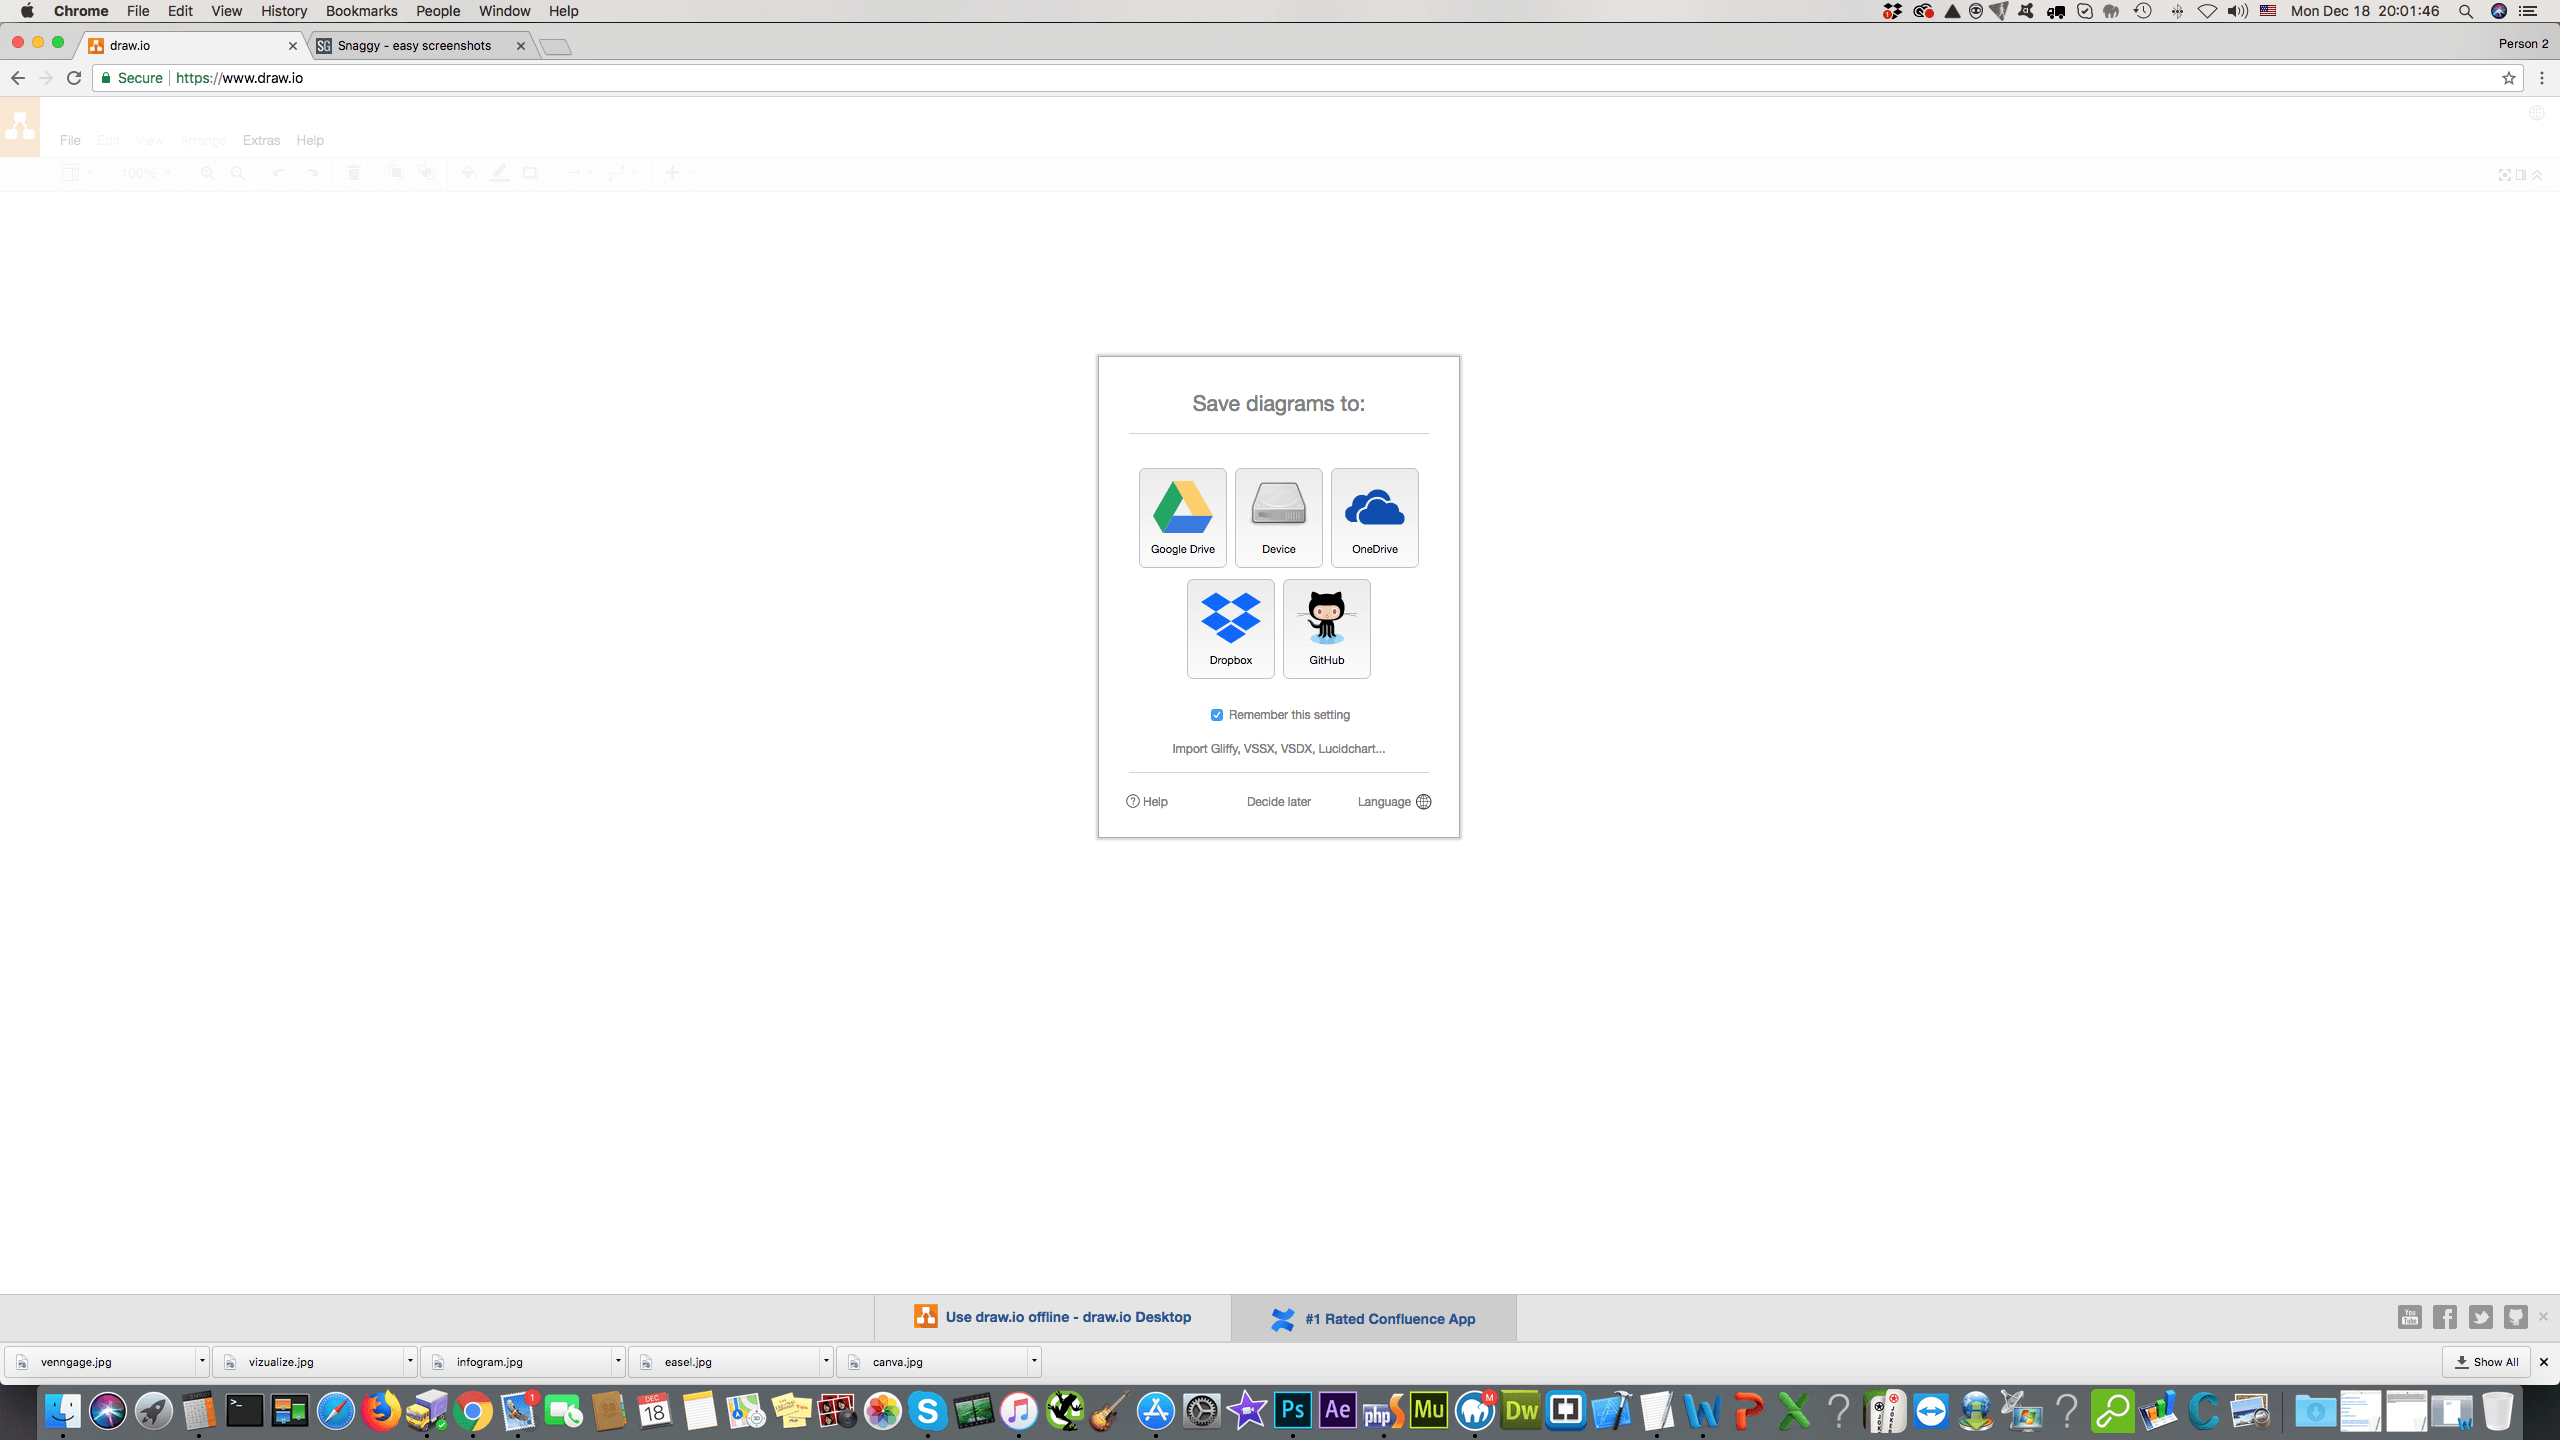
7. Draw io – It is an online tool that can be used to create flowcharts suitable for both external and internal projects. The tool is offered for absolutely free of charge and can be used by everyone, professional and amateurs as well. The steps that have to be taken to create a flowchart are outlined and by followed those steps the outcome can be reached within minutes. To design the flowchart, please follow this link which will direct you to the official website: https://www.draw.io/
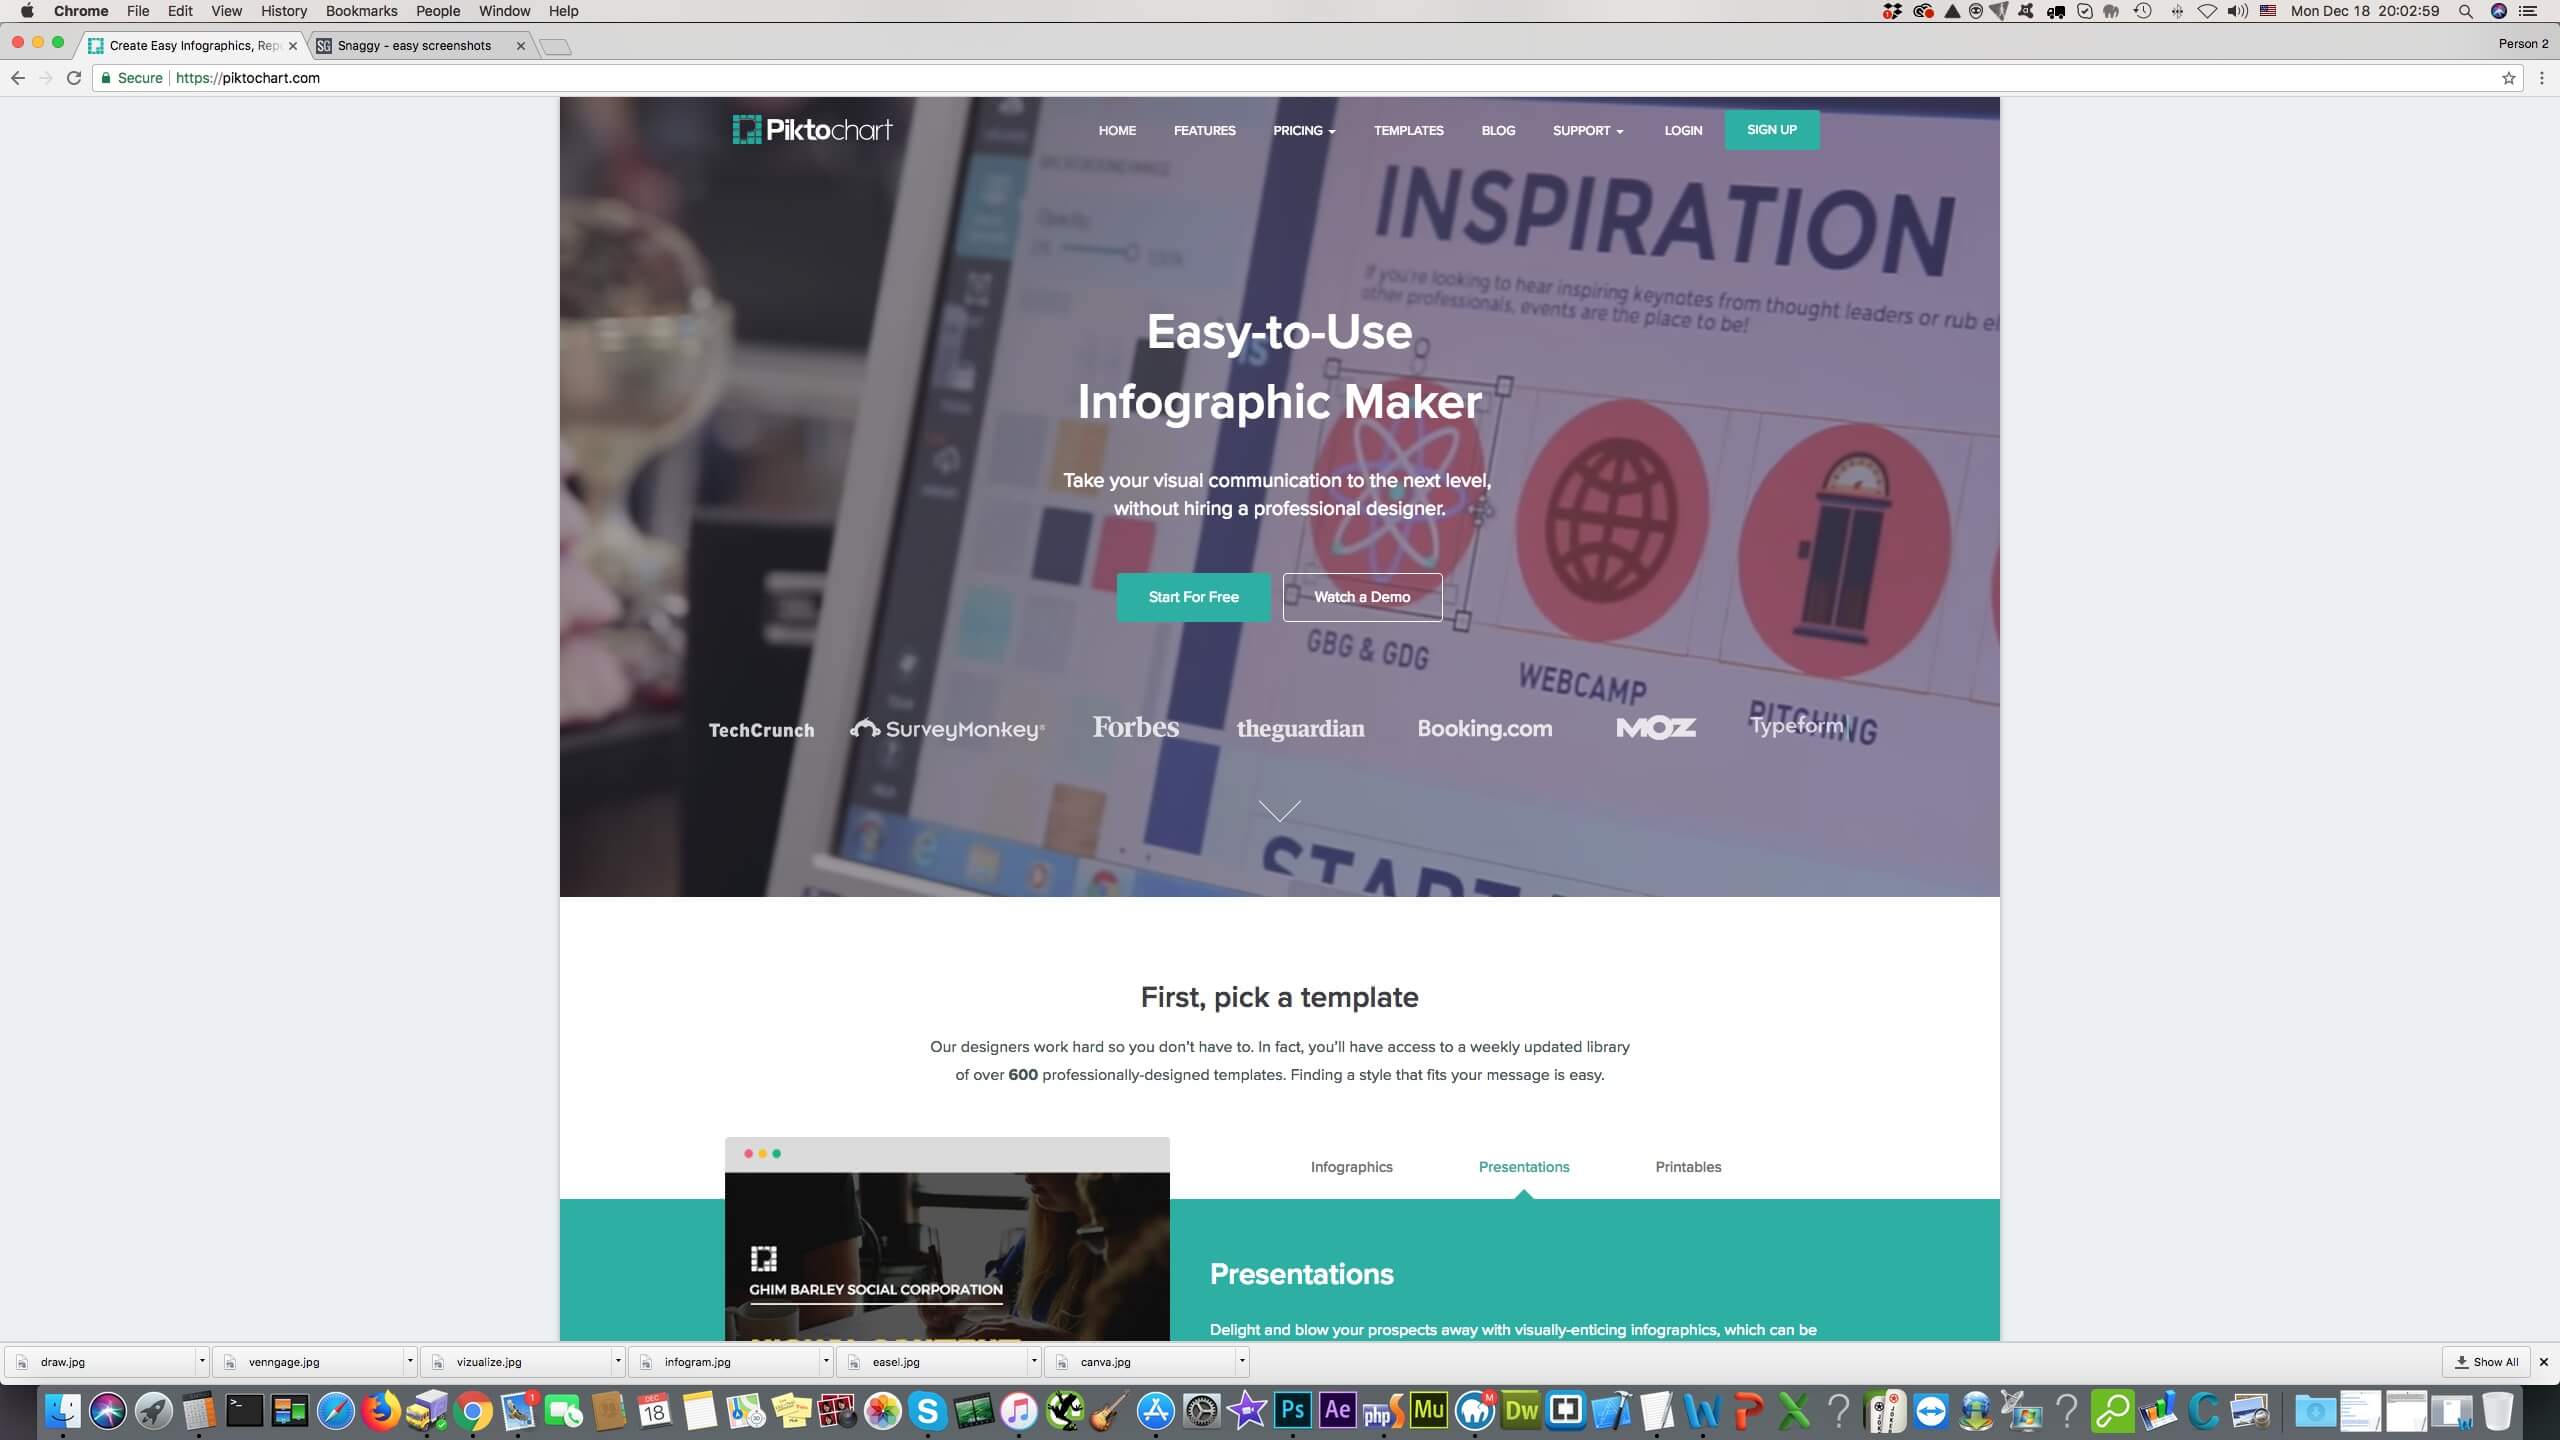
8. Piktochart – It is a simplified tool for infographics, it has functions like drag-and-drop and point-and-click. Therefore, there is no more need for complex design softwares or expensive designing agencies. It offers more than 600 premium quality templates from which can be chosen one that suits you the most. You will also have the access for icons, images, charts, maps, high resolution downloads, and ready-to-use graphics. All of these benefits can be gained by paying a little price, 15$ or 29$ monthly, depending what features you are searching. For more thorough information, please visit their official website which can be found here: https://piktochart.com/
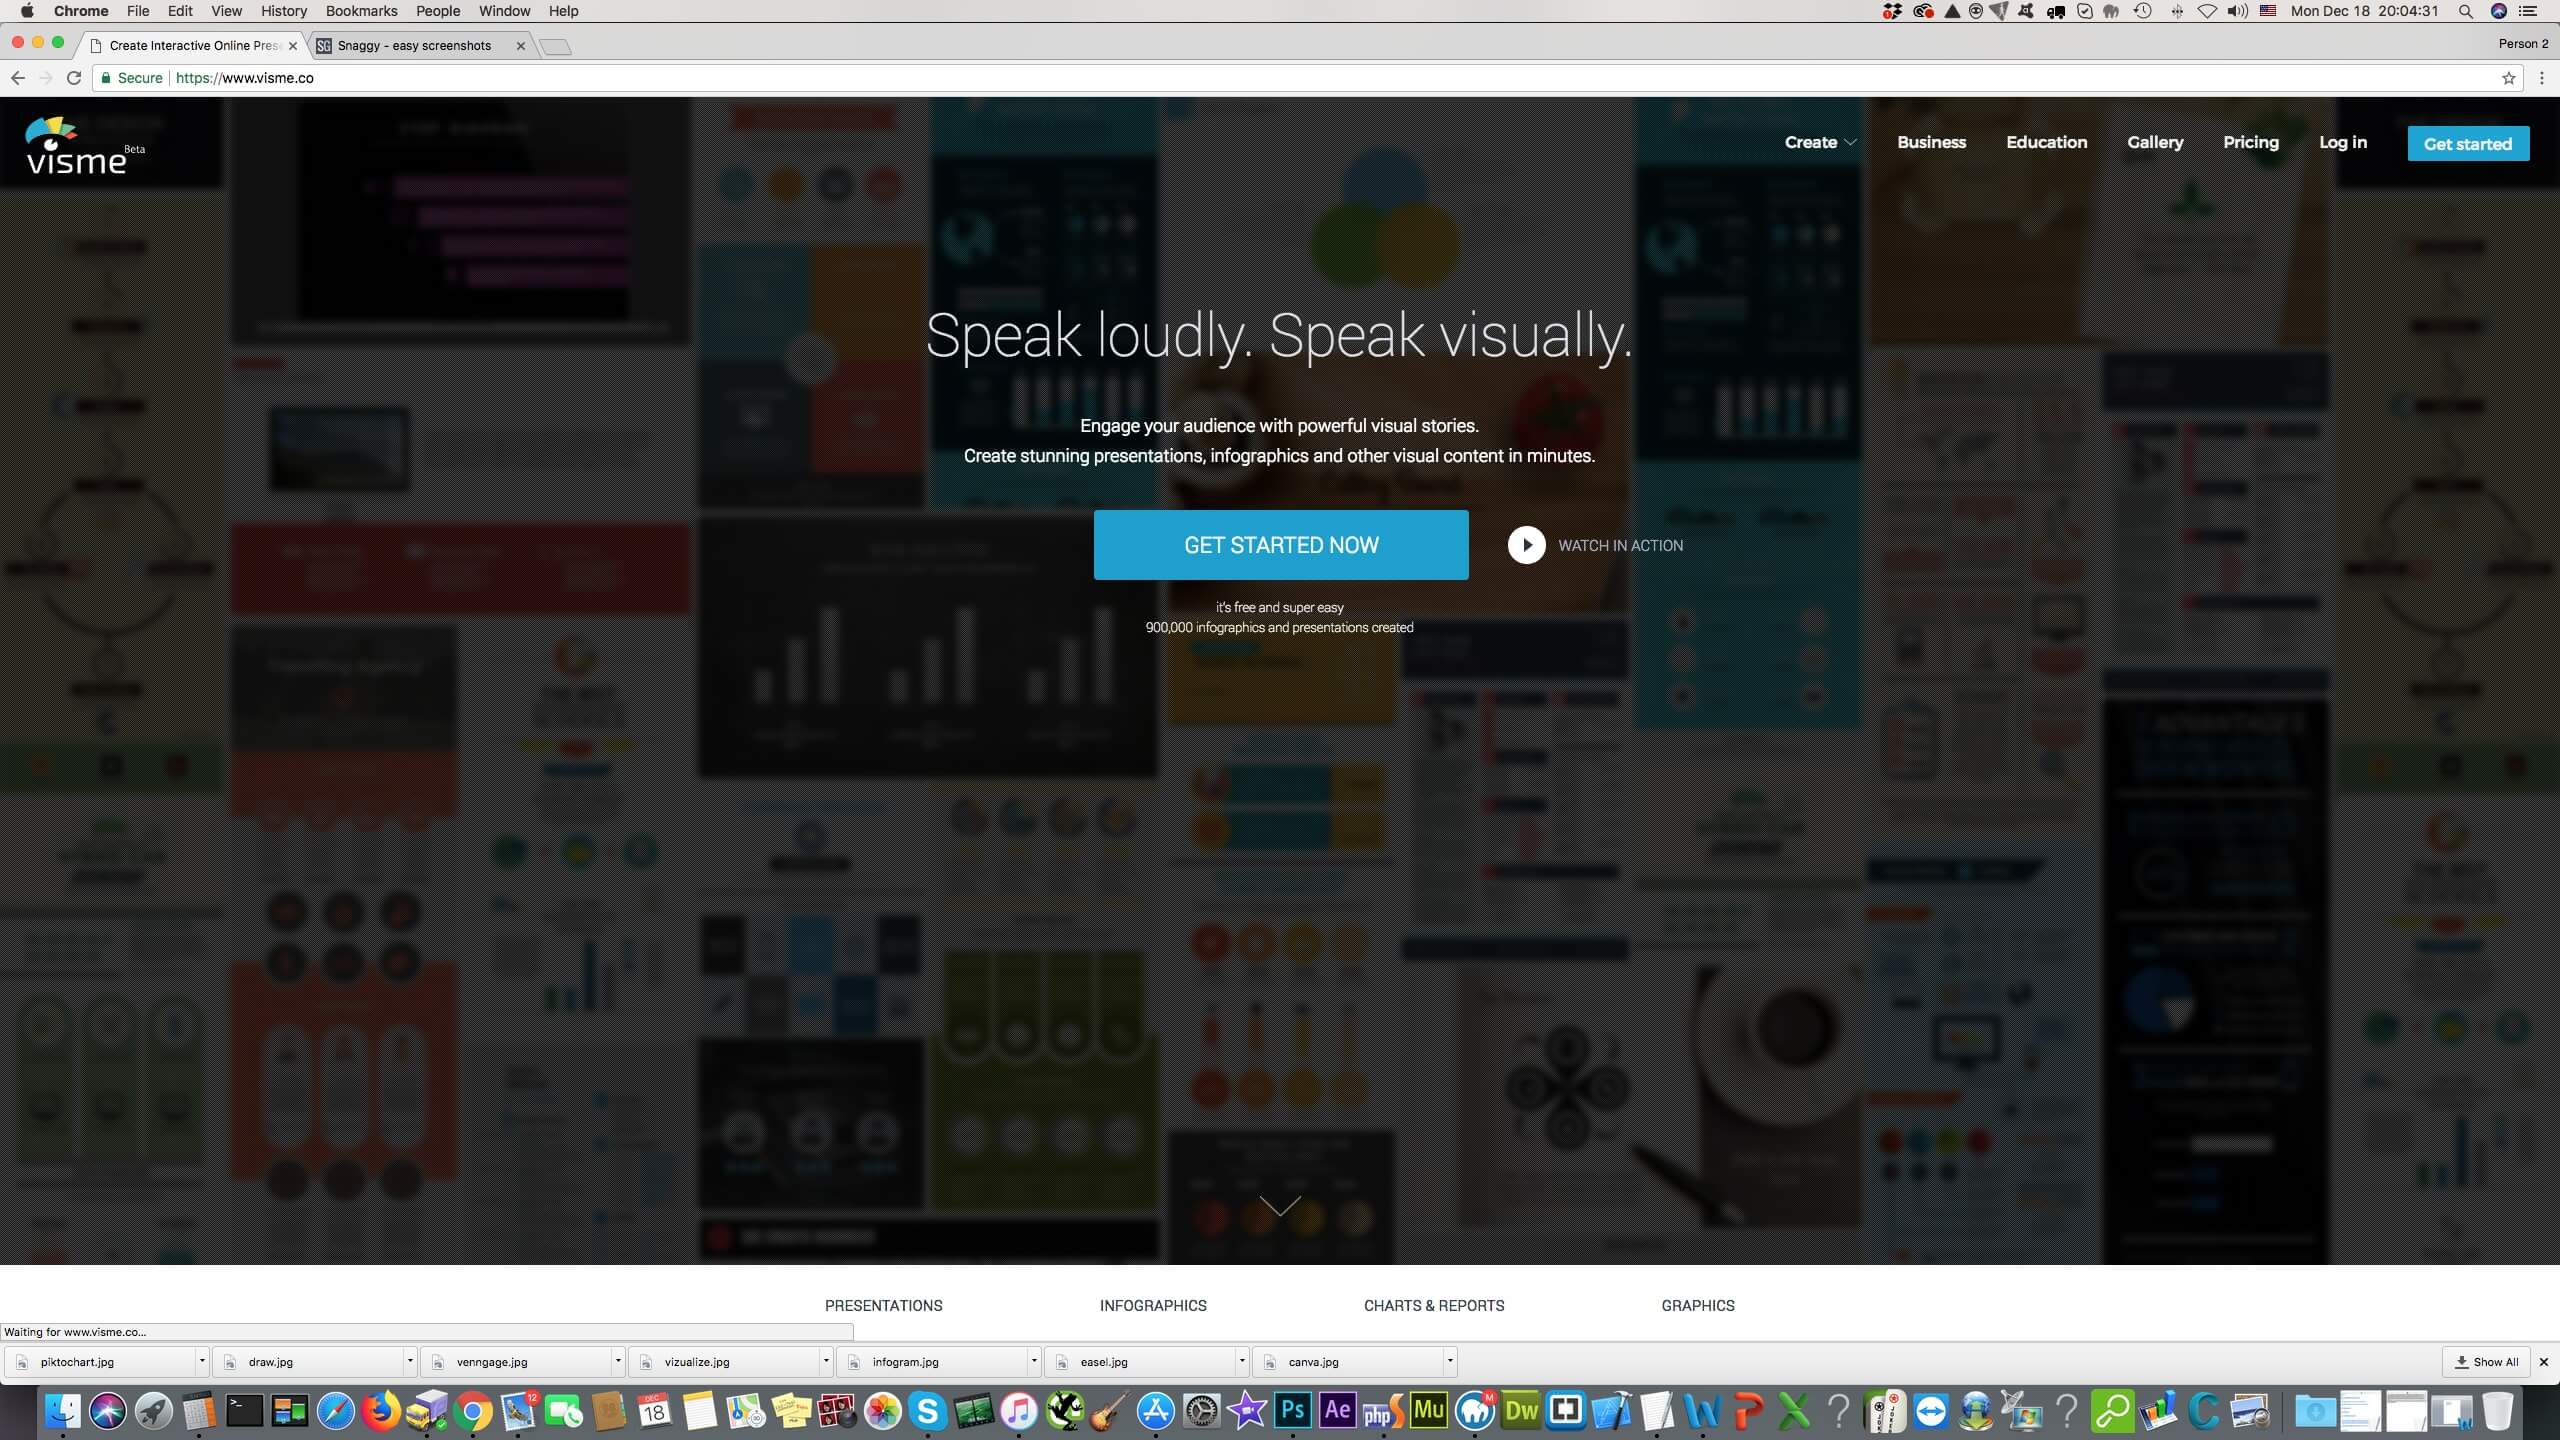
9. Visme – It is an online infographic tool that helps to transform your thoughts and information into visual representation. The infographic creation process is extremely easy and includes only three steps. First you either have to choose the infographic template or create your own layout. Then you have to fill it out with desired information and data using graphs, tables, maps, images, icons and etc. And the last step is to customize and edit everything like fonts colors, backgrounds and etc. For more information please visit their official webpage: https://www.visme.co/
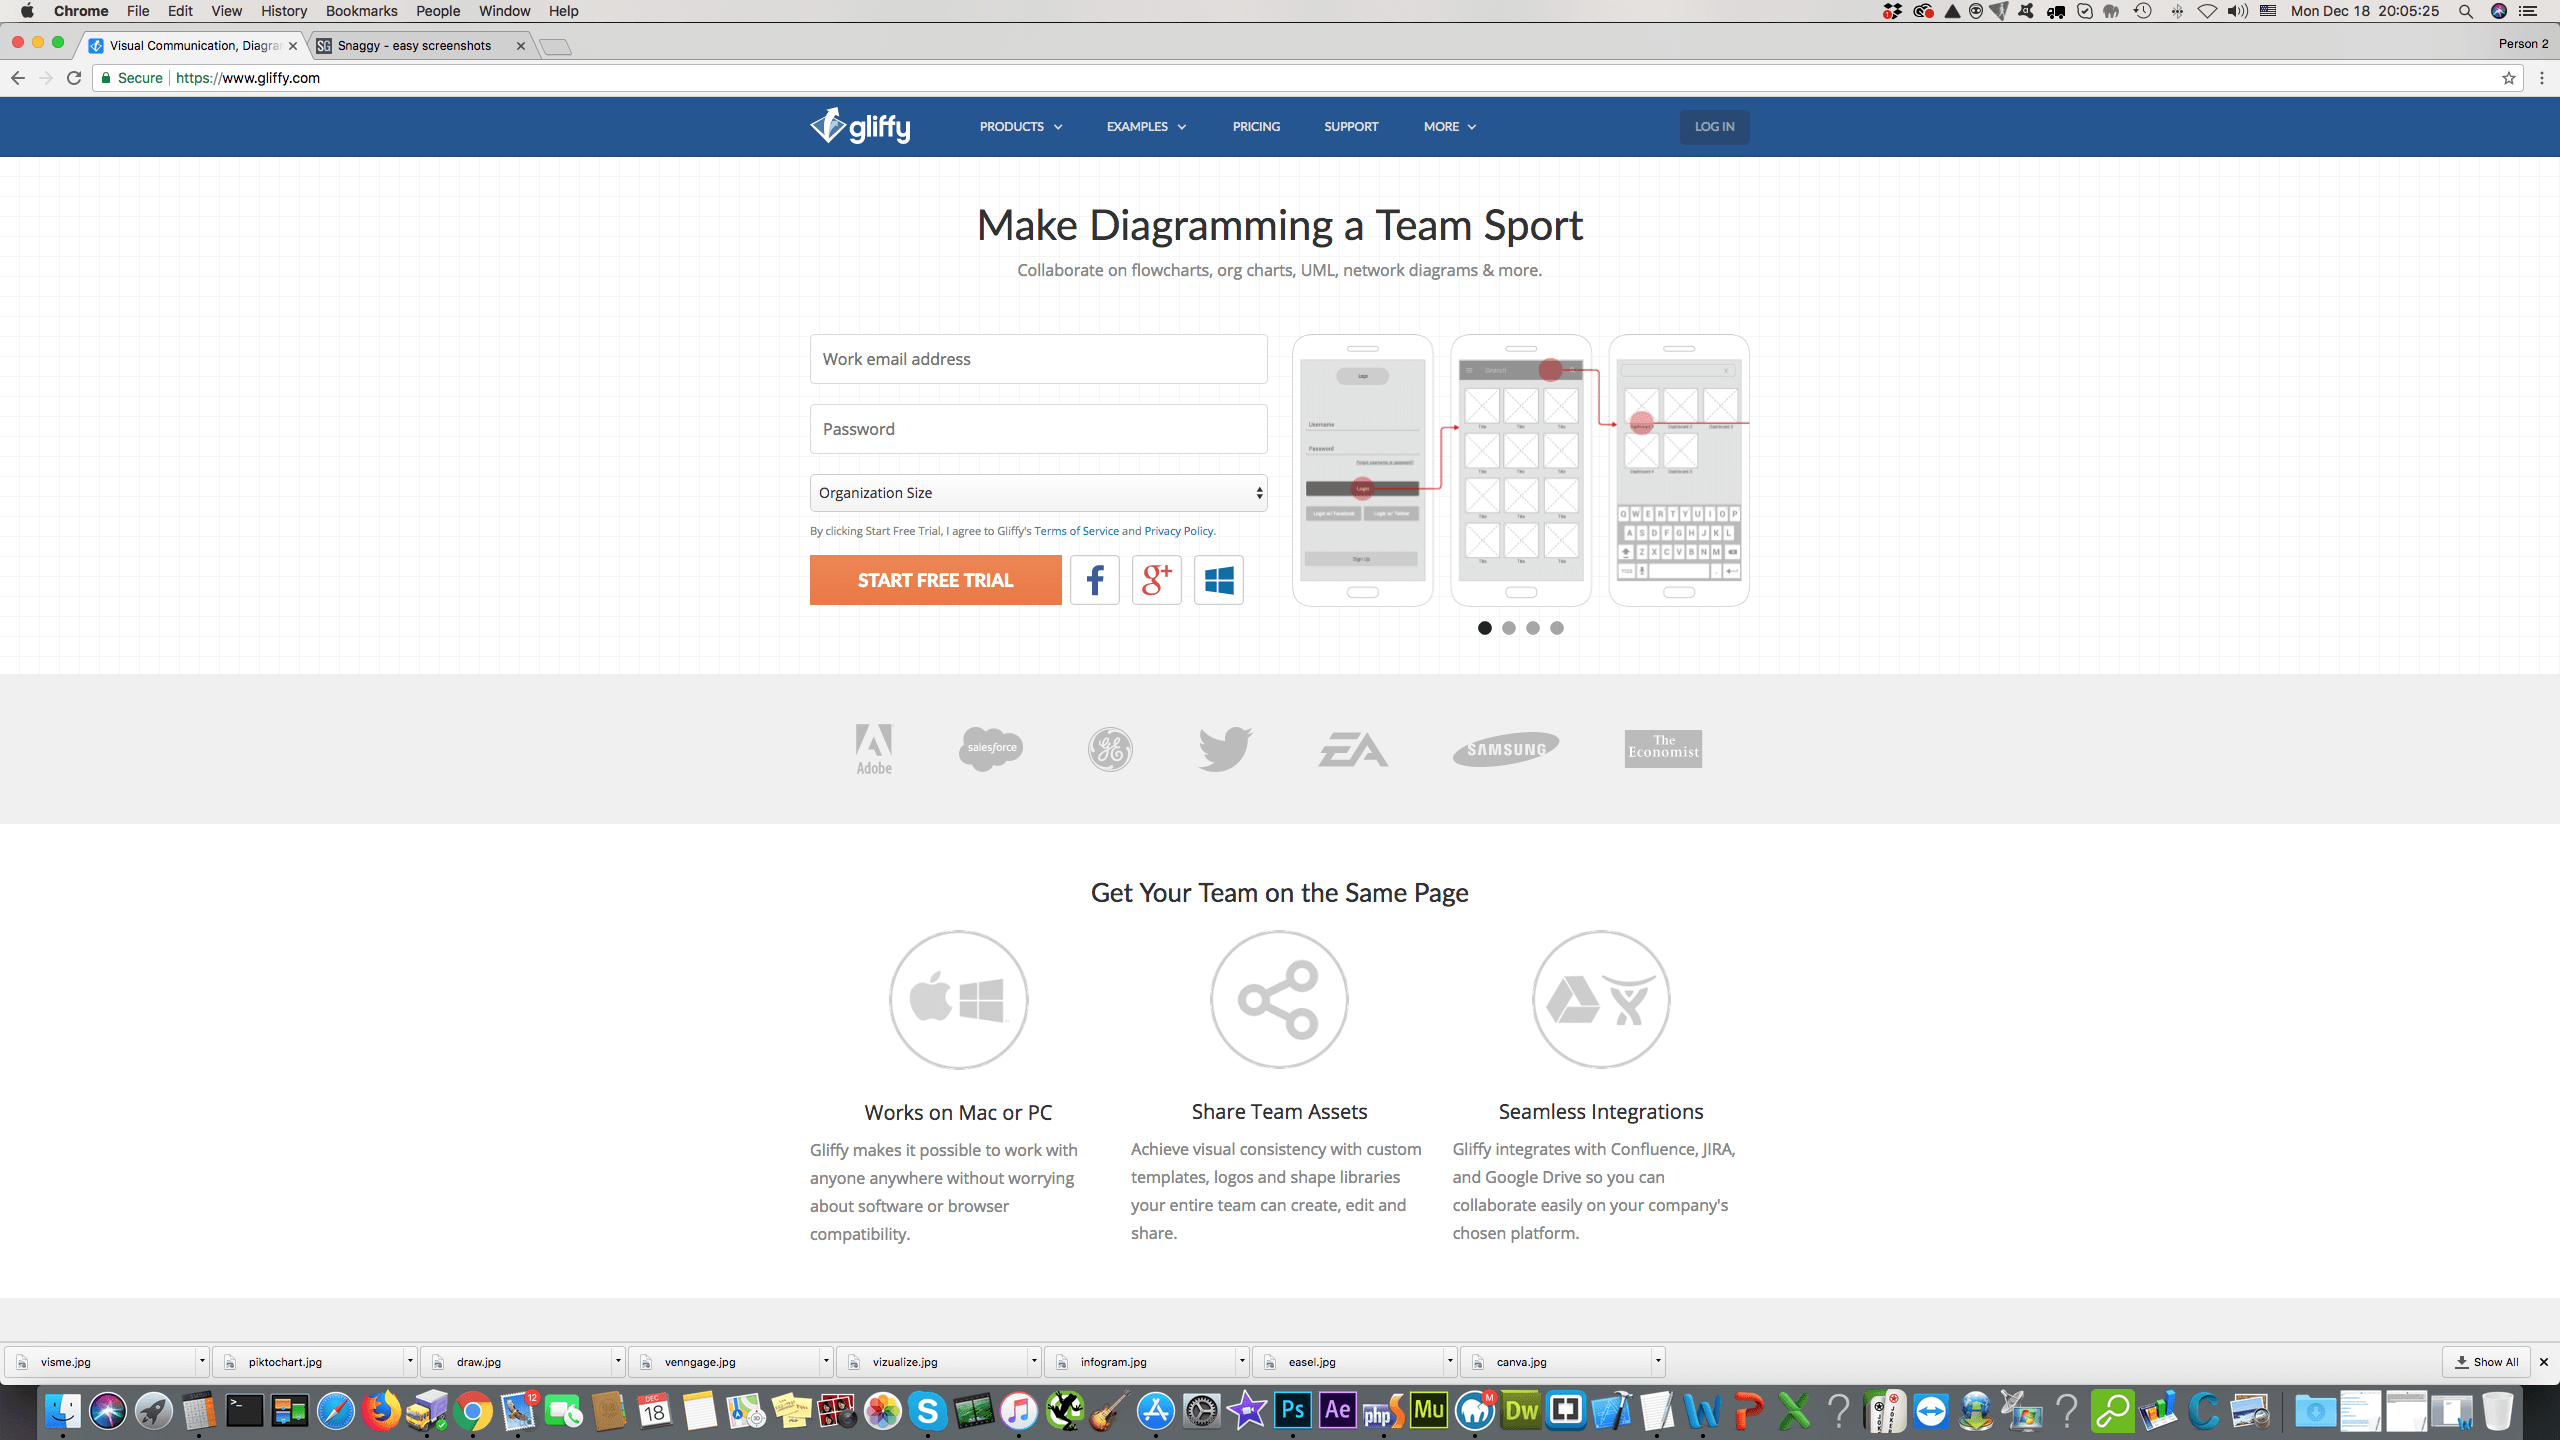
10. Gliffy – It is online diagramming tool that has a lot of benefits to offer to its customers, for instance it runs on an HTML5 editor which is twice as fast as flash. Therefore, you can create and edit huge diagrams without wasting a lot of time. It is easy to use since it has drag-and-drop function and point-to-click way to format, therefore there is no special knowledge or experience is needed to. You can also collaborate instantly with anyone who can view and edit your diagram and also give some comments and feedback. So if you have to create diagrams, then do not miss chance and employ this tool that can be found here: https://www.gliffy.com/
As you might notice all of these Infographics tools have a lot to offer and we hope that after reading this article you will know when to apply each of these tools.

Comments
No comments yet.